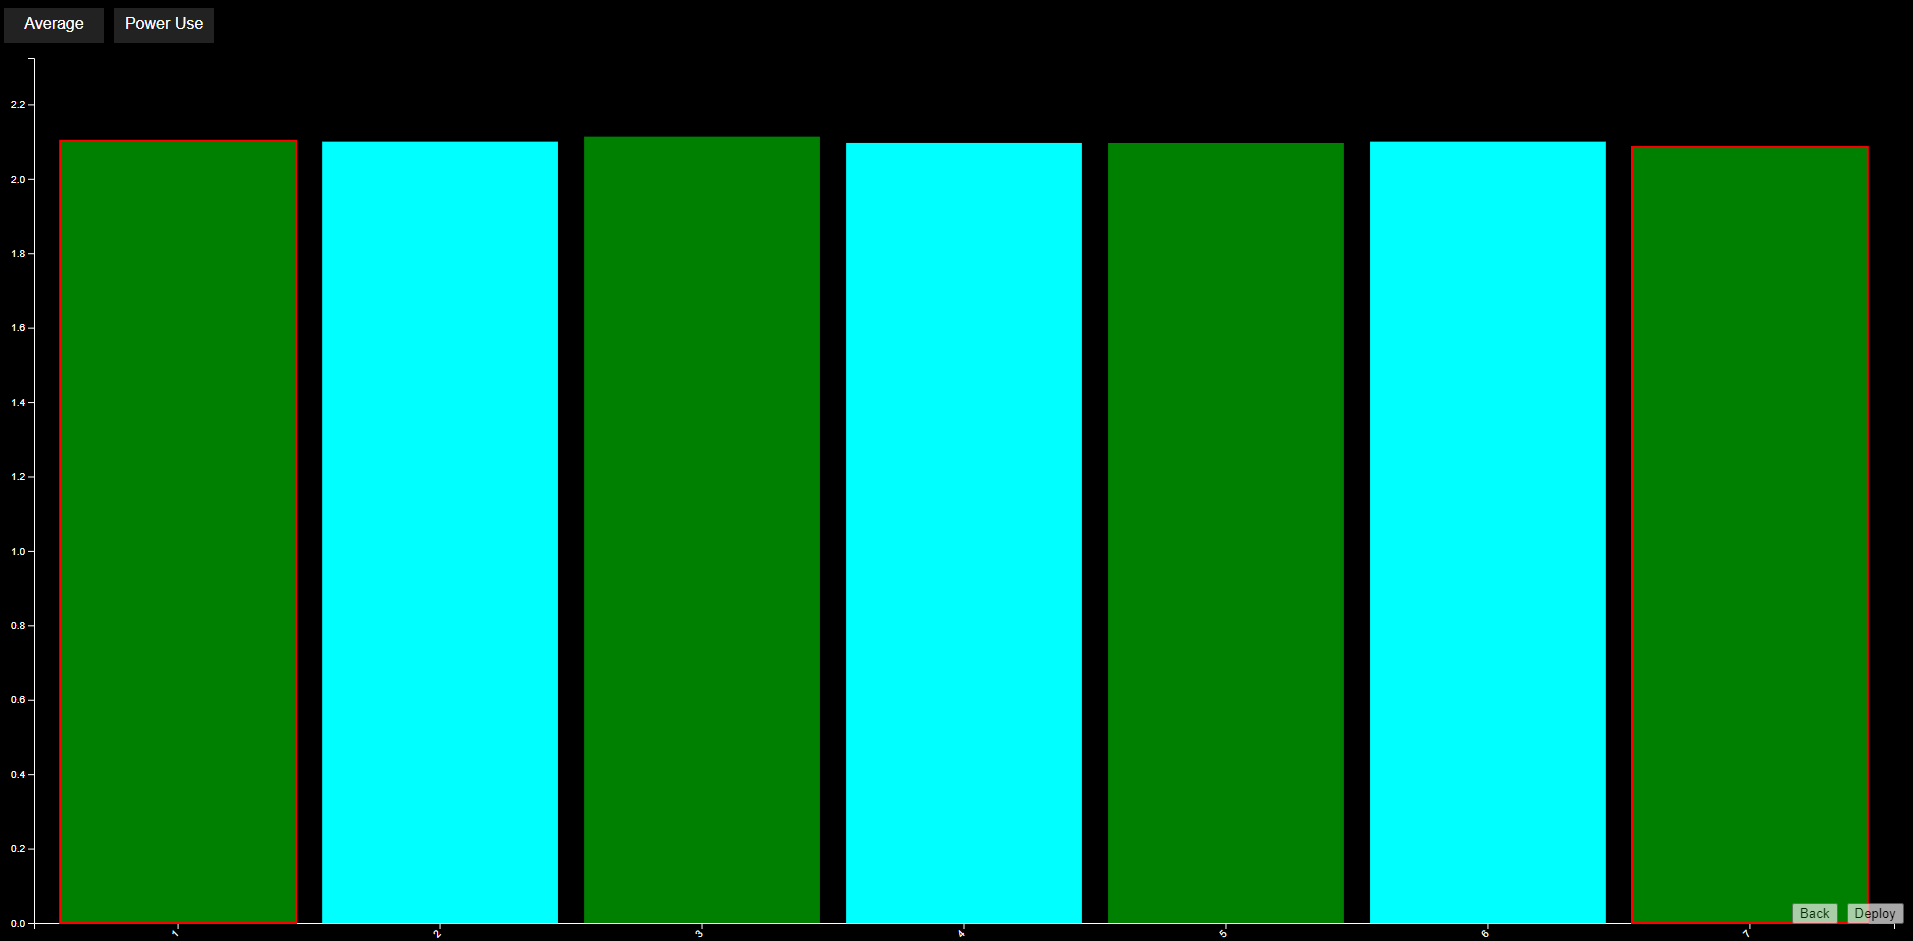
Count Example: Number of State Changes Per Day
In this example, we want to know how many times our machine stopped and started every day.
Our machine has a simple 'running' signal that is 0 when the system is off, and 1 when it's on.
Available Information
| Asset | Property | Desc |
|---|---|---|
| Main Machine | Running | A digital value showing if the machine is running |
Initial Layout
To begin with, we have one Pivot node named Pivot On, and one Total Output node named Total
The output node is fed from an ARDI Point (a point of data from the field), while the pivot is driven from a Time Difference node.
Step 1: Choose the Pivot
Our first step is to choose what we are going to pivot on.
Fortunately, the default should work fine here. Simply choose a date in YYYY-MM-DD HH:MM:SS format that you want to use as the 'base' of your day.
For example, if your official 'day' starts at 9:00AM, you might want to use that time as the basis of your days.
To set the name of the node,
- Right click on the top-left node, choose Title and type 'Day Number'
Step 2: Choose the Data to Count
Next, we need to choose the data we want to count.
The counter will increase by 1 every time the incoming data changes.
Because this is an enumeration/discrete point of data, we'll replace our ARDI Point with an ARDI Status.
- Right-click on the ARDI Point, choose 'Remove'
- Right-click in empty space, choose 'Add', 'ARDI' and 'ARDI Status'
- Choose Main Machine.Running as the property.
- Connect the output of this new point to the Counter node.
Analytic Complete
And you're done - by pressing Save and Visualise, you'll have a simple analytic showing the number of times your machine changed state.
Doing More
One issue is that we're counting all changes - meaning we're counting every time the machine turns on and off. It would be more meaningful to our users if we just counted the times it switched on.
We can use the Ignore node to ignore transitions from 1 to 0 and only count those from 0 to 1.
- Right-click an empty area, choose 'Add', 'Count' and 'Ignore'
- Drag the false output of the ARDI Status node to the 'Active' input of the new Ignore node.
This now tells the algorithm to ignore (ie. don't count) any transitions where the running status is 0. In effect, this only counts those movements from 0 to 1, rather than 1 to 0.


