====Line Graph of All Properties====
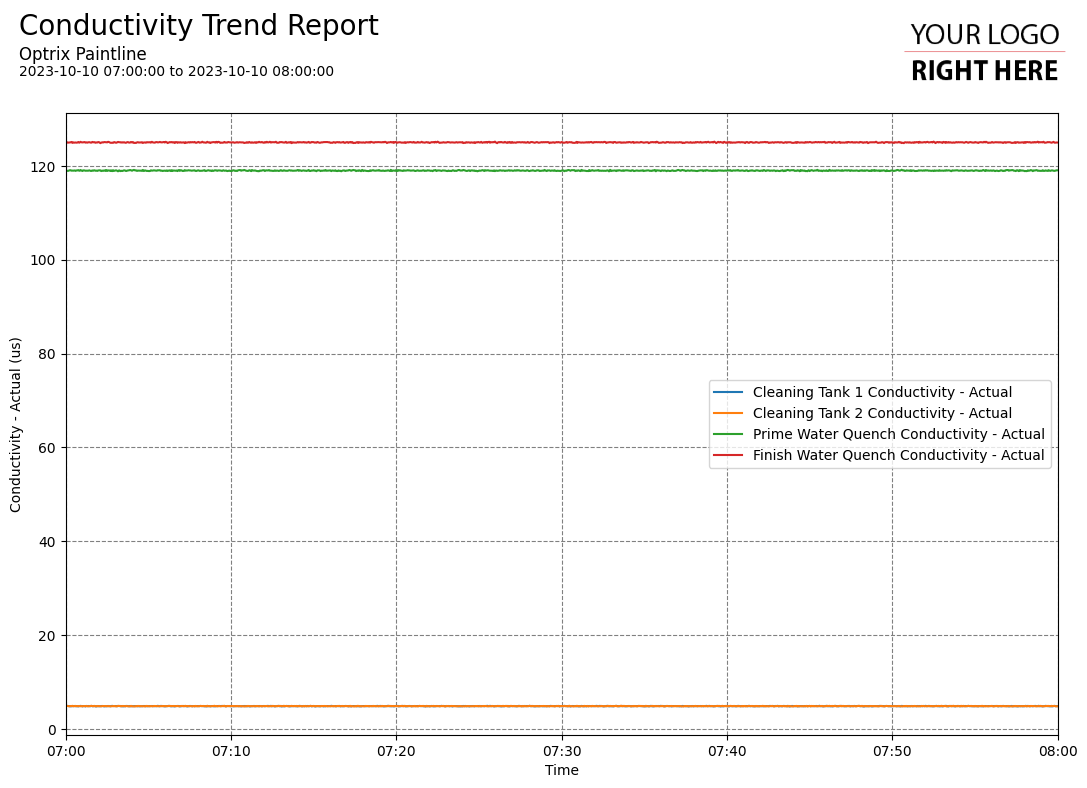
This [[code:reports|code sample]] of a line-graph report.
It contains **every** property of a particular type - in the example below, it's all of the //conductivity// measurements being made across the site.
 ==Customising==
^Element^Replace With^
|[PROPERTY]|The name of the property you want to report on|
|[UNIT NAME]|The name of the units (ie. Temperature)|
|[UNIT]|The actual unit of measurement (ie. Deg C)|
==The Code==
==Customising==
^Element^Replace With^
|[PROPERTY]|The name of the property you want to report on|
|[UNIT NAME]|The name of the units (ie. Temperature)|
|[UNIT]|The actual unit of measurement (ie. Deg C)|
==The Code==
import ardi.util.mplreport

@mplreport.ardireport("Sample Report")
def CreateReport(report,args):

   #Set up the report page
   fig,ax = report.CreatePage(1)
   report.Title()

   #Fetch the report data
   thedata = report.FetchHistory("'[PROPERTY]' PROPERTYEX ALLPOINTS")
   frame = thedata.data

   #Draw the lines
   for colname in frame.columns:
        ax.plot(frame[colname],label=colname)

   #Setup the axes
   ax.margins(x=0)
   ax.grid()
   ax.legend()
   ax.set_xlabel("Time")
   ax.set_ylabel("[UNIT NAME] [UNIT]")
   report.TimeAxis(ax.xaxis)

   report.Save()