This is an old revision of the document!
AI Anomaly Detector State Page
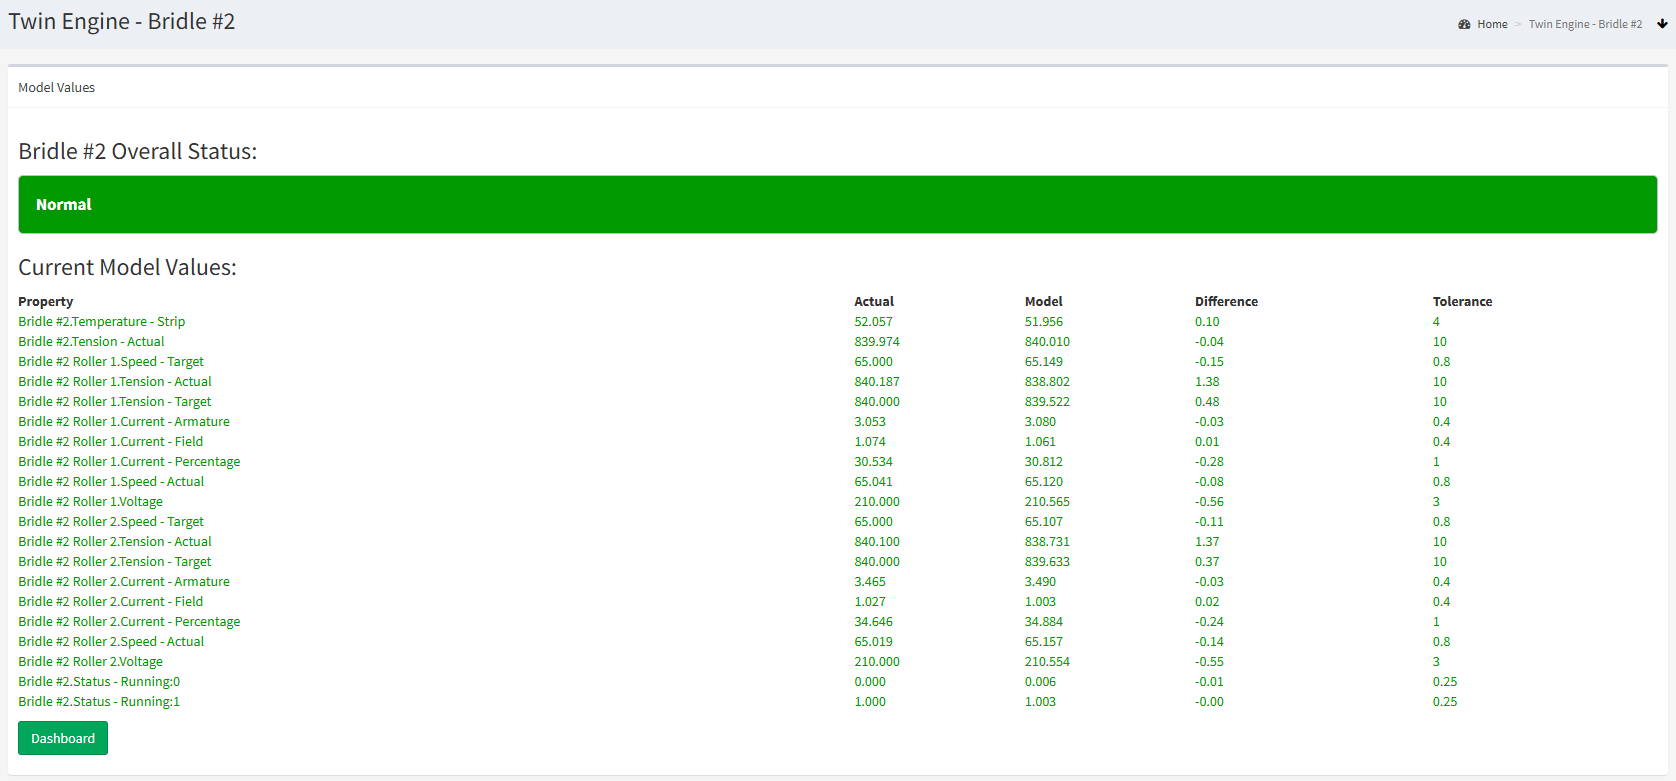
The page above shows an example AI Anomaly Detector model state.
Overall Status
The top banner shows the overall state of the asset. It will be green when normal (the live values are similar to the model predictions), and red when abnormal.
Detailed Status
The information below the banner shows each individual channel that the model estimates, compared to the actual, live value from the asset.
If the difference between the modelled value and the live value exceeds a given threshold, it will be highlighted in red.
Value Balance
The AI model tries to predict the balance of your data values given the situation.
The red channels may indicate where your process is out-of-balance. When you see them, you'll often see some that are higher than expected, and some that are lower than expected. These will often be linked.
For example, a too-high temperature along with a too-low speed will indicate that your temperature is too high given the speed. When detected, this might prompt people to send out a technician to check for blockages or see if the machine requires lubrication.
Extreme Differences
Please note that the cause can only be seen if the issue is subtle. Our intention is to help you pick up a problem before it causes failures, downtime and quality losses.
The more extreme the anomaly is, the wilder the predictions become, and while the system will still detect the anomaly, its won't always be able to highlight a reason.
If you see almost all of your estimates way off target, it would indicate your asset is in a state well outside the AIs training data.
