Comparing
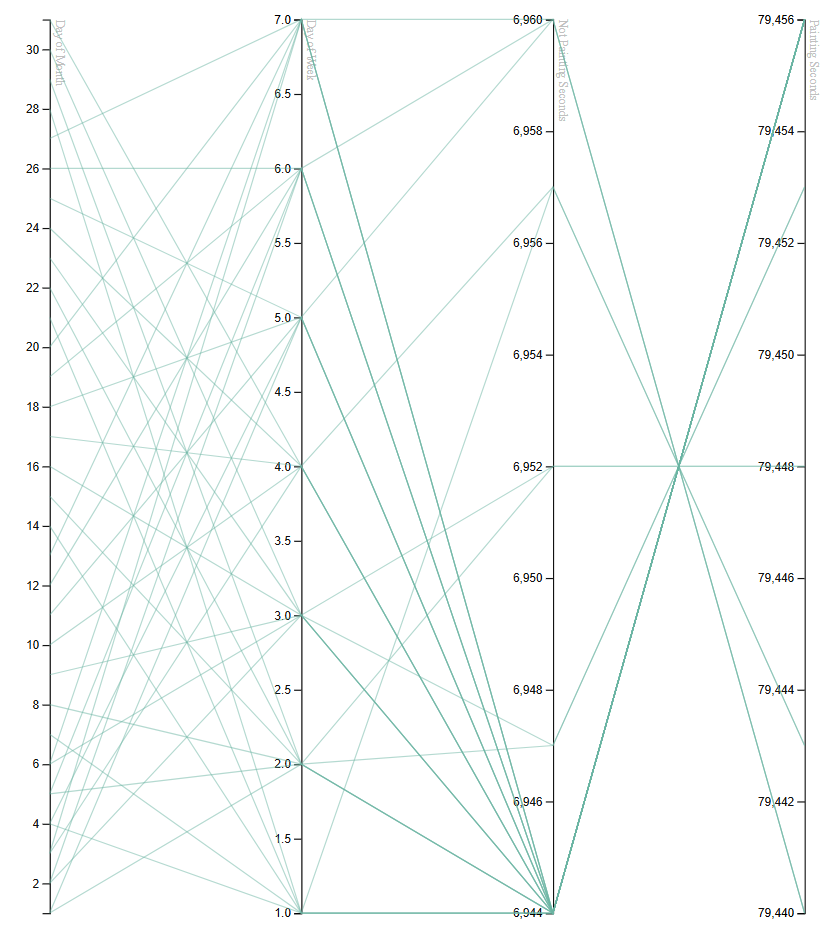
Available from the capture list, this page lets you compare the chosen captures.
For example, if you were keeping track of the different batches of product you were producing, you could use this function to find out the root cause of a quality issue.
Min/Max Values
At the top of the page is a list of minimum and maximum values for each captured point of data. Note that this will only display values that actually change across the different captures - if the value is identical for every capture, it simply won't appear in the list.
Clicking on a minimum or maximum amount will take you to the matching capture details.
It's important to remember that the minimum values will not always belong to the same day/shift/batch/event.
Distribution
If you are interested in analysing the distribution of values against other values, click on the name of one of the captured attributes.
This will take you to the data distribution page.

