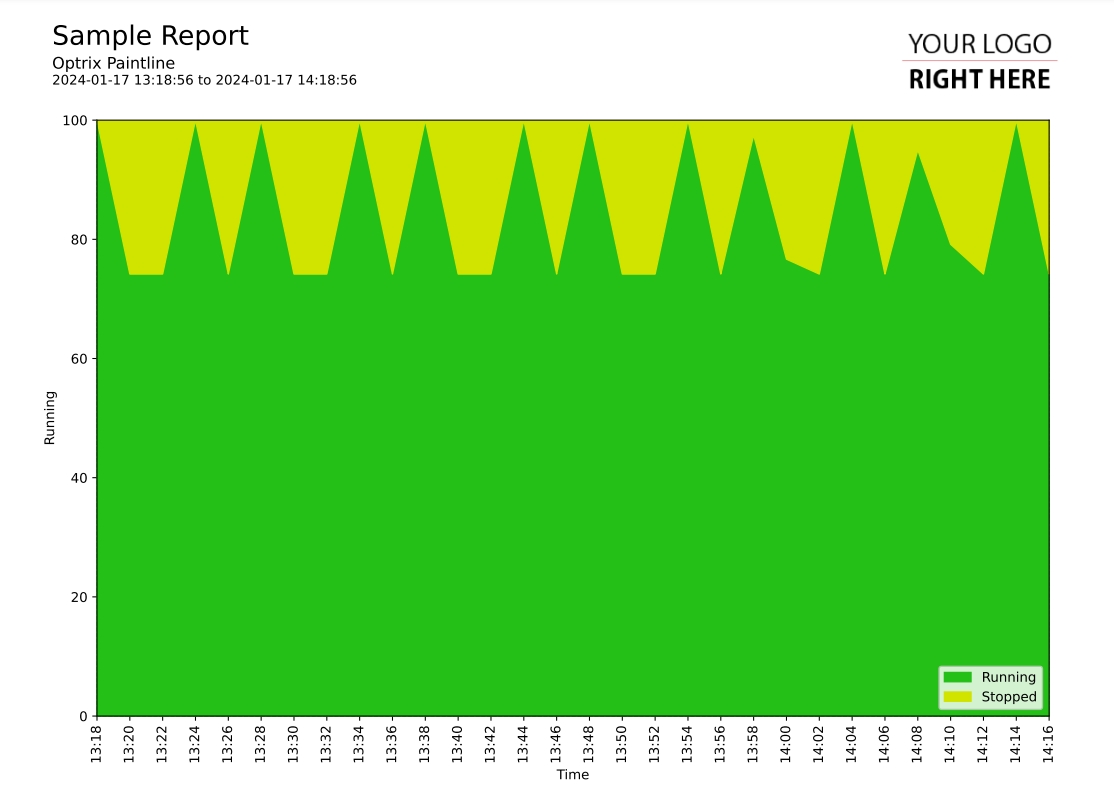
Discrete Stacked Area Chart
This code sample of a area chart report.
This creates a stacked area chart of a single discrete property such as an on/off or a stopped/starting/running/stopping value.
This style of report tries to answer two questions at the same time - how much of the time an asset was in a particular state, and when these states happened.
It's less accurate than horizontal status-charts would be, but it's extremely effective when reporting on long periods of time, where the detail on status-charts can be lost.
Customising
| Element | Replace With |
|---|---|
| [ASSET] | The name of the asset you want to report on |
| [PROPERTY] | The name of the property you want to report on |
The Code
import os
import sys

sys.path.insert(0,os.path.dirname(os.path.dirname(__file__)))

import mplreport
import datetime
import discretepatterns as dp

@mplreport.ardireport("Sample Report")
def CreateReport(report,args):

    #Create a page containing a single plot.
    fig,ax = report.CreatePage(1)

    #Print a title block for the page.
    report.Title()

    #Our AQL query goes here
    query = "'[ASSET]' ASSET '[PROPERTY]' PROPERTY VALUES"

    #Get the pandas data-frame with the results.
    data = report.FetchHistory(query)
    df = data.data

    #Get a colour map to convert values to colours
    map = report.GetDiscreteColourMap(data,df.columns[0])
    valmap = data.GetValueMap(df.columns[0])

    #Choose the value order...
    order = [1,0]

    #Set the number of distinct buckets...
    buckets = 30

    #Calculate the bucket size
    totalspan = (df.index[len(df.index)-1] - df.index[0]).total_seconds()
    perbucket = totalspan / buckets

    #Pre-calculate the edges of each bucket...
    edges = [None] * (buckets+1)
    base = df.index[0]
    for x in range(0,buckets):
        edges[x] = base
        base += datetime.timedelta(seconds=perbucket)
    edges[buckets] = df.index[len(df.index)-1]

    #Use the 'Discrete Patterns' class to convert discrete data into time frames
    patterns = dp.DiscretePatterns()
    patterns.SetDataframe(df)
    patterns.Ready()

    #Set up an array to store the results for each possible value, for each bucket
    values = [None] * buckets
    for x in range(0,buckets):
        values[x] = [0] * len(order)

    #Grab a list of all of the times spent in each value.
    frames = patterns.GetAllTimeframes(df.columns[0])
    for x in range(0,buckets):
        indx = 0
        for o in order:
            if o in frames:
                for f in frames[o]:
                    if f[0] < edges[x+1] and f[1] >= edges[x]:

                        #This frame overlaps the current bucket
                        st = f[0]
                        en = f[1]

                        #Trim the data from the bucket edges
                        if st < edges[x]:
                            st = edges[x]
                        if en > edges[x+1]:
                            en = edges[x+1]

                        #Record the amount of time
                        framelen = (en - st).total_seconds()
                        values[x][indx] += framelen

            indx += 1

    #The cumulative totals so far, so we can draw the next area above the previous one.
    sofar = [0] * buckets

    #Draw the area chart
    indx = 0
    for o in order:
        #Build a row of bucket data
        thisrow = [0] * buckets
        for x in range(0,buckets):
            thisrow[x] = sofar[x] + ((values[x][indx] / perbucket) * 100)

        #Draw our area
        ax.fill_between(range(0,buckets),sofar,thisrow,label=valmap[o],color=map[o])

        #Record the new top layer
        sofar = thisrow
        indx += 1

    #Set the minimum Y value to 0
    ax.set_ylim(0,100)

    #Make x-axis points
    edgeset = []
    for e in edges:
        edgeset.append(e.strftime("%H:%M"))
    ax.set_xticks(range(0,buckets+1))
    ax.set_xticklabels(edgeset,rotation=90)

    #Clean up and prettify
    ax.margins(x=0)
    ax.set_xlabel("Time")
    ax.set_ylabel("[PROPERTY]")
    ax.legend(loc='lower right')

    #Save this report out.
    report.Save()
