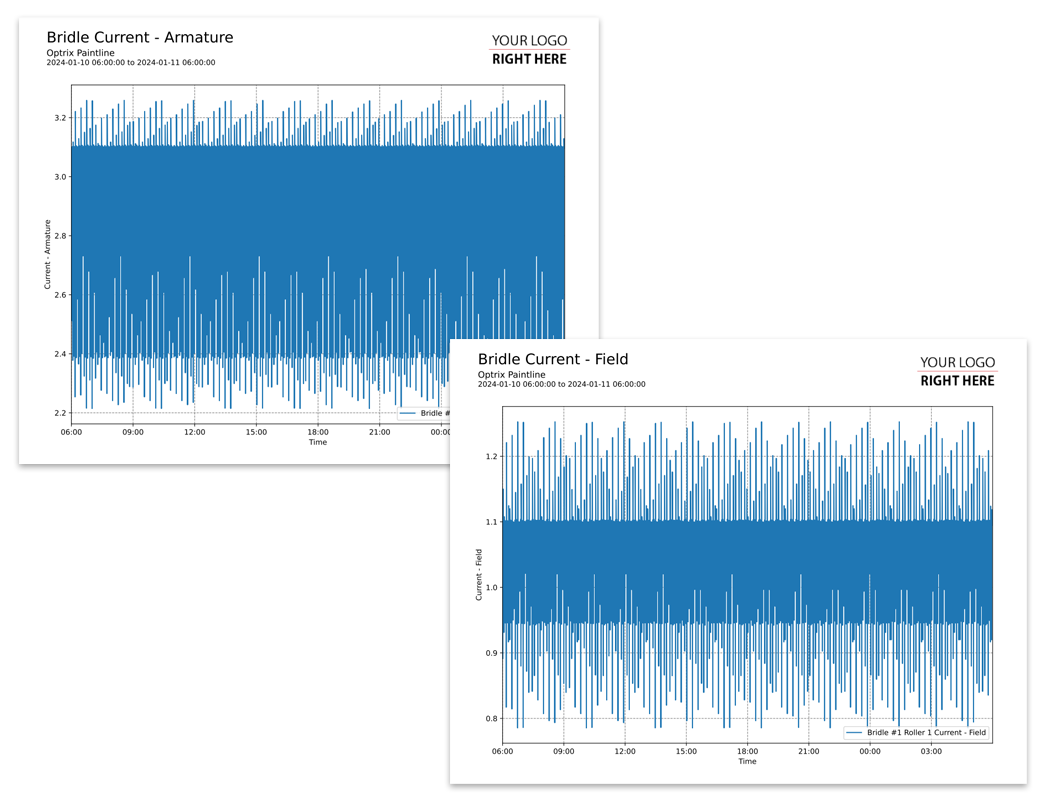
Multiple Properties Across Many Pages
This code sample of a line-graph report.
The report focuses on a single asset, but many properties, each of which is given their own full page.
Customising
| Element | Replace With |
|---|---|
| [ASSET] | The asset you want to report on |
| [PROPERTY1] etc | The names of the properties you want to report on |
| [TITLE] | The title to place on each page of the report |
The Code
import os
import sys

sys.path.insert(0,os.path.dirname(os.path.dirname(__file__)))

import mplreport
import datetime

@mplreport.ardireport("Sample Report")
def CreateReport(report,args):

    #List of properties to show
    properties = ['[PROPERTY1]','[PROPERTY2]']

    #Format the list for the query...
    proplist = []
    for prp in properties:
        proplist.append("'" + prp + "'")

    #Our AQL query goes here
    query = "('[ASSET]') ASSET (" + ",".join(prp) + ") PROPERTY VALUES"

    #Get the pandas data-frame with the results.
    df = report.GetHistory(query)

    #For each property...
    for x in range(0,len(properties)):

        #Create a page containing a single plot.
        fig,ax = report.CreatePage(1)

        #Print a title block for the page.
        report.Title(override="[TITLE] " + properties[x])

        #Draw the columns that belong to this property
        for k in df.columns:
            if properties[x] in k:
                ax.plot(df[k],label=k)

        #Clean up and prettify
        ax.margins(x=0)
        ax.set_xlabel("Time")
        ax.set_ylabel(properties[x])
        ax.legend(loc='lower right')

        report.TimeAxis(ax.xaxis)
        report.Grid(ax)

    #Save this report out.
    report.Save()
