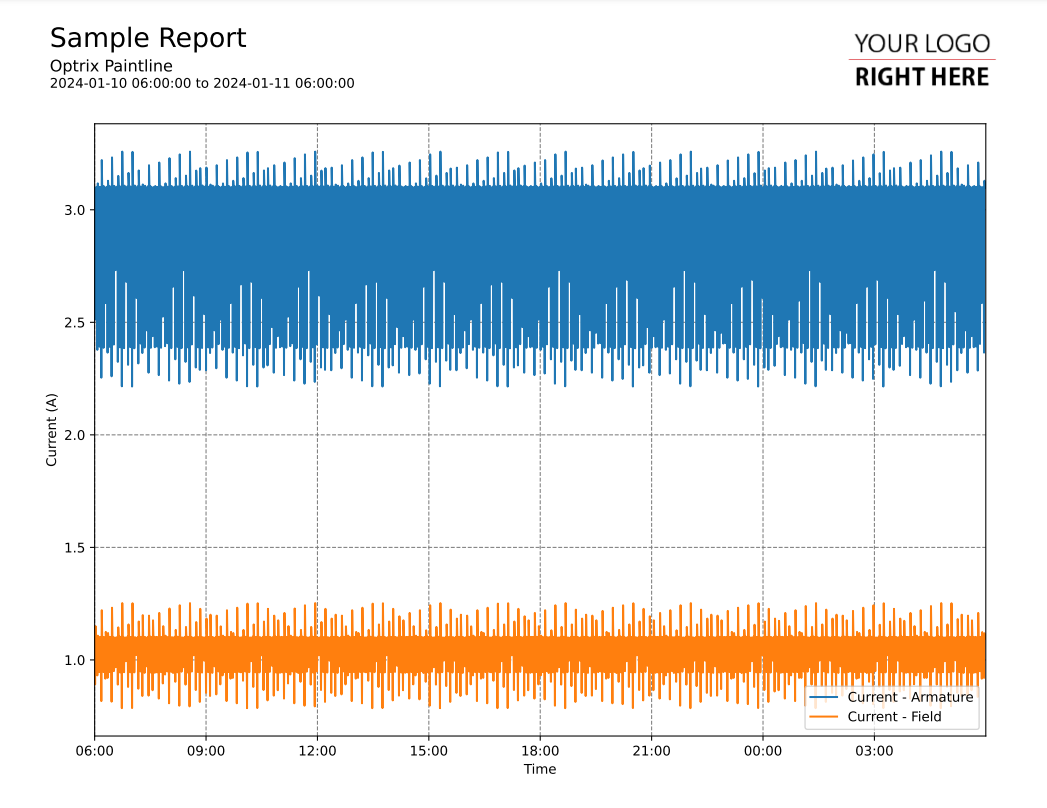
Multiple Properties Across A Single Plot
This code sample of a line-graph report.
It contains several different properties on the same page, all on the same set of axes.
Note that you should avoid this when there are large numbers of channels, or when the lines represent different types of measurement (ie. pressure vs temperature), unless they are directly related.
Customising
| Element | Replace With |
|---|---|
| [ASSET] | The asset you want to report on |
| [PROPERTY1] etc | The names of the properties you want to report on |
| [UNIT NAME] | The name of the units (ie. Temperature) |
| [UNIT] | The actual units (ie. Deg C) |
The Code
import os
import sys

sys.path.insert(0,os.path.dirname(os.path.dirname(__file__)))

import mplreport
import datetime

@mplreport.ardireport("Sample Report")
def CreateReport(report,args):

    #Create a page containing a single plot.
    fig,ax = report.CreatePage(1)

    #Print a title block for the page.
    report.Title()

    #Our AQL query goes here
    query = "('[ASSET]') ASSET ('[PROPERTY1]','[PROPERTY2]') PROPERTY VALUES"

    #Get the pandas data-frame with the results.
    df = report.GetHistory(query)

    for k in df.columns:
        ax.plot(df[k],label=k.replace("[ASSET] ",""))

    #Clean up and prettify
    ax.margins(x=0)
    ax.set_xlabel("Time")
    ax.set_ylabel("Current (A)")
    ax.legend(loc='lower right')

    report.TimeAxis(ax.xaxis)
    report.Grid(ax)

    #Save this report out.
    report.Save()
