Using Infographics
The Infographics addon gives you access to a range of interactive, data-driven displays from your ARDI system.
These displays can use live and historical data to analyse and visualise data in a way that is accessible from a huge range of devices and easy for people to understand.
Choose Infographics from the ARDI sidebar on the left of the page to access the Infographic Menu.
Opening an Infographic
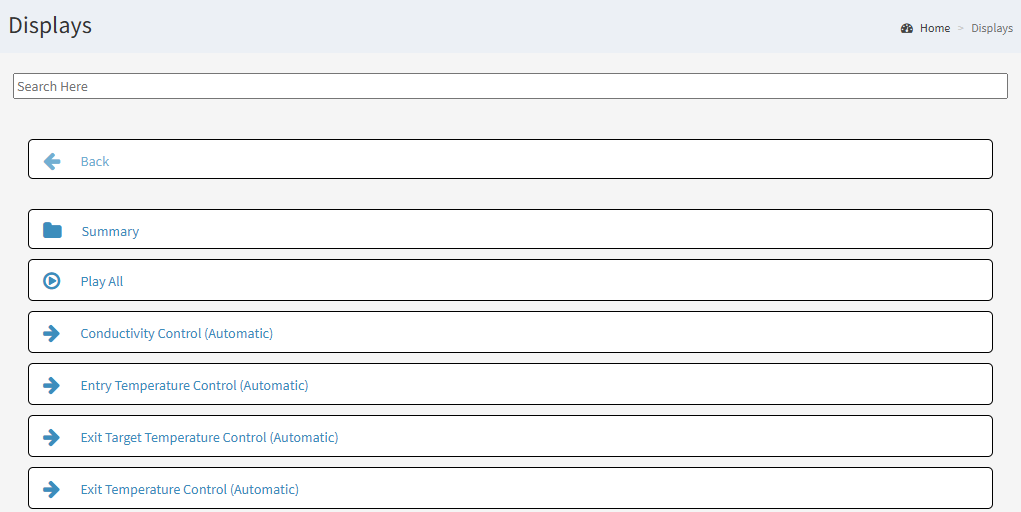
Infographics are arranged into folders. These folders split your different displays up into topics or areas of interest.
You can open a folder by simply clicking on it - this will open that folder, displaying any sub-folders or infographics inside.
You can open an infographic by clicking on its name, which will take you directly to the display page.
Note that a single infographic can appear in multiple folders.
Searching
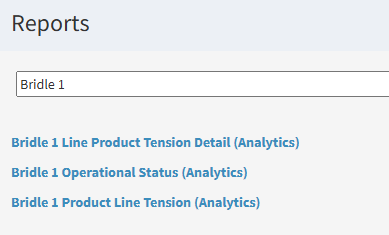
You can also search for a display using the search bar at the top of the list of infographics. Simply start typing the name of the display you're looking for, and it should appear in the pop-up list below.
Once you've chosen a display, you'll be taken to the display page.
Playlists
If a folder contains more than one display, you can use the Play All button to start a playlist that will step through each display in the folder one-by-one, looping through continually.
These are great for kiosk displays. Since these visuals are all web-based, you can build a display using very basic hardware.

