Sequence UI
When you click on an Sequence test in FirstSite, you'll be taken to a web page that looks like the one below…
Test Results
At the top of the page are your test results, showing you if the asset is running in an unusual way.
In most cases, you want this to be either white (not yet trained) or green (OK). In the example above, it's yellow - indicating a warning.
Observations
Below the test results are the observations. These are the findings of the system without the machine learning AI.
The system looks at the chart and checks for…
| Bad Data | Data that is null or invalid |
| Outliers | Data points that are significantly higher or lower than others |
| Discrepancies | Sudden drops in data value between two consecutive assets |
If you haven't trained your AI as yet (see below), your test will return a warning if there is anything in the list of observations.
Note that these observations aren't always a bad thing. These sudden drops or tall outliers might be part of normal operation for your plant.
This is where training the analytic can be helpful.
When Trained
'Training' is the term used when teaching a Machine Learning system. In this case, we can train the system to recognise what normal looks like for each of our sequences.
If you're logged into ARDI as an Administrator, you can do this using the This Is Normal button, which records the current values as new training data.
The machine learning model overrides any observations - it's perfectly normal for a trained AI to be showing a 'good' result even though there are lines in the list of observations.
Chart
The chart below the test results is an illustration of the 'shape' that the AI sees.
This chart follows the path of your sequence relationship, making it possible to understand roughly where each asset lies relative to one-another.
You can also identify each bar in the chart by hovering your mouse over it, or touching it on a tablet/mobile screen.
Closest Match Summary
This section only appears if you've trained the AI for this sequence..
Machine learning algorithms are terrible at explaining why they give you the results they give.
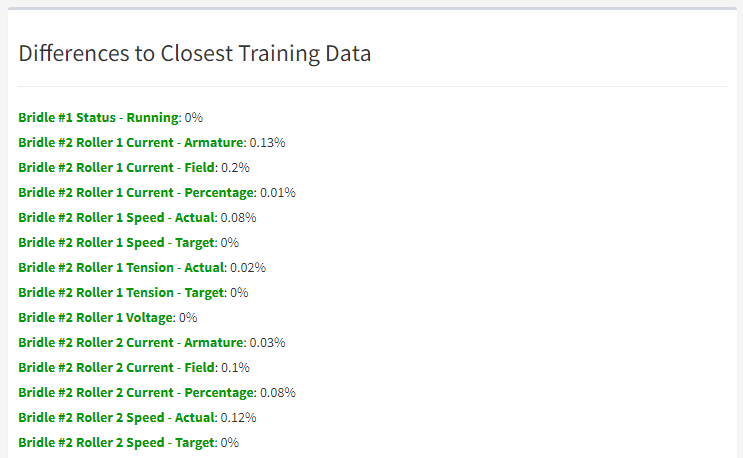
To help understand why you're getting certain results, you'll find a list at the bottom of the page that shows you the difference between each of your properties and the closest overall match that could be found in your training data.
In some cases, this can help you see which property is causing the AI to decide the asset is abnormal.

