Count Example: Daily Total from Totaliser
In this example, we want to know how much our machine has produced per day.
While our machine gives us a 'total production' value, it resets back to zero every time someone interrupts the power - which happens several times a day.
This analytic will give us a quick and easy daily total.
Available Information
| Asset | Property | Desc |
|---|---|---|
| Weight Sensor | Total Weight | A numeric value showing how much product since the last startup |
Initial Layout
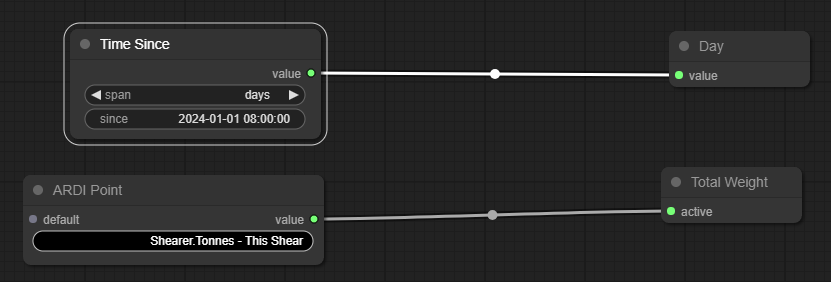
To begin with, we have one Pivot node named Pivot On, and one Total Output node named Total
The output node is fed from an ARDI Point (a point of data from the field), while the pivot is driven from a Time Difference node.
Step 1: Choose the Pivot
Our first step is to choose what we are going to pivot on.
Fortunately, the default should work fine here. Simply choose a date in YYYY-MM-DD HH:MM:SS format that you want to use as the 'base' of your day.
For example, if your official 'day' starts at 9:00AM, you might want to use that time as the basis of your days.
To set the name of the node,
- Right click on the top-left node, choose Title and type 'Day Number'
Step 2: Change the Node Type
The default counter graph includes the Changes node, which counts the number of times the incoming data changes. We don't want this.
We want to base our total on an existing total value. So we want to replace the Changes node with a Totaliser node.
- Right-click on the Total node and choose 'Remove'
- Right-click in empty space, choose 'Add', 'Count' and 'Totaliser'
- Drag the output of the lower ARDI Point into the new node
Step 3: Choose the Total
Next, we need to choose the data we want to totalise.
In this case, there are two parts to this machine that each have their own power usage monitoring. Although pivot analytics can have more than one output, in this case we only care about the total power being used, so we need to add the power usage together.
- Click on the ARDI Point.
- Choose Weight Sensor - Total Weight as the property.


