Count Example: Calculate Per-Shift Energy Use
In this example, we want to know how much power our different shifts and crews are using.
Our power meters have a simple 'kWh' output that we can use.
Available Information
| Asset | Property | Desc |
|---|---|---|
| Incomer Meter | Power Usage | A measured amount of power usage. |
Initial Layout
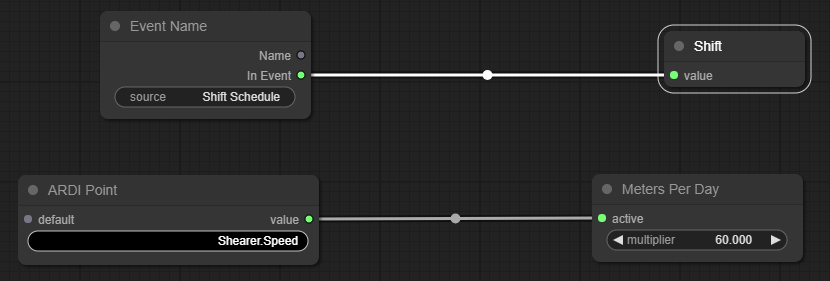
To begin with, we have one Pivot node named Pivot On, and one Total Output node named Total
The output node is fed from an ARDI Point (a point of data from the field), while the pivot is driven from a Time Difference node.
Step 1: Choose the Pivot
Our first step is to choose what we are going to pivot on.
In this case, we want the totals per shift or per crew. We can do this by pivoting on the name of the current Event.
- Right-click on the Time Difference node and choose 'Remove'
- Right-click in empty space, choose 'Add', 'ARDI' and 'Event Name'
- Enter the name of the Event Source - in this case, 'Shift Schedule'.
- Drag the lower output from the Event Name node into the Pivot node.
- Right-click the Pivot node, choose 'Title' and type 'Shift'
Step 2: Change the Node Type
The default counter graph includes the Total node, which works if we already have some sort of count data.
In this case, we want to convert a rate to a total. So we want to replace the Total node with a Rate node.
- Right-click on the Total node and choose 'Remove'
- Right-click in empty space, choose 'Add', 'Count' and 'Rate'
- Make sure the time multiplier is set to 3600 (one hour in seconds)
- Right-click the new node, choose 'Title' and type 'Power Usage'
Step 3: Choose the Data to Count
Next, we need to choose the data we want to totalise.
We can use the existing ARDI Point.
- Click on the ARDI Point and change the name to 'Incomer Meter.Power Usage'
NOTE: The above example is actually calculating total meters travelled per day, but the logic is identical.


