Event Detection Example: Energy Spikes
In this example, we'd like to point out when any of our machines are running at more than 100% of their rated power.
Available Information
| Asset | Property | Desc |
|---|---|---|
| Motor | Current - Percentage | The amount of current, relative to nameplate maximum |
Initial Layout
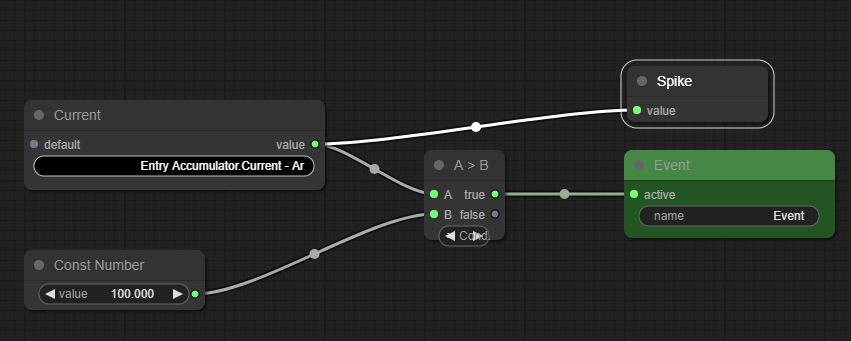
To begin with, we have one Event Output node, one ARDI Point, a Numeric Constant and a Condition node.
Step 1: Capture When Current > 100%
First, we need to choose the right property to read from.
- Click on None on the the ARDI Point node
- Choose Motor Current - Percentage from the list
Next, we set the threshold we want to use to determine if we're over the maximum current draw.
- Click on the Const Number option, and enter '100'
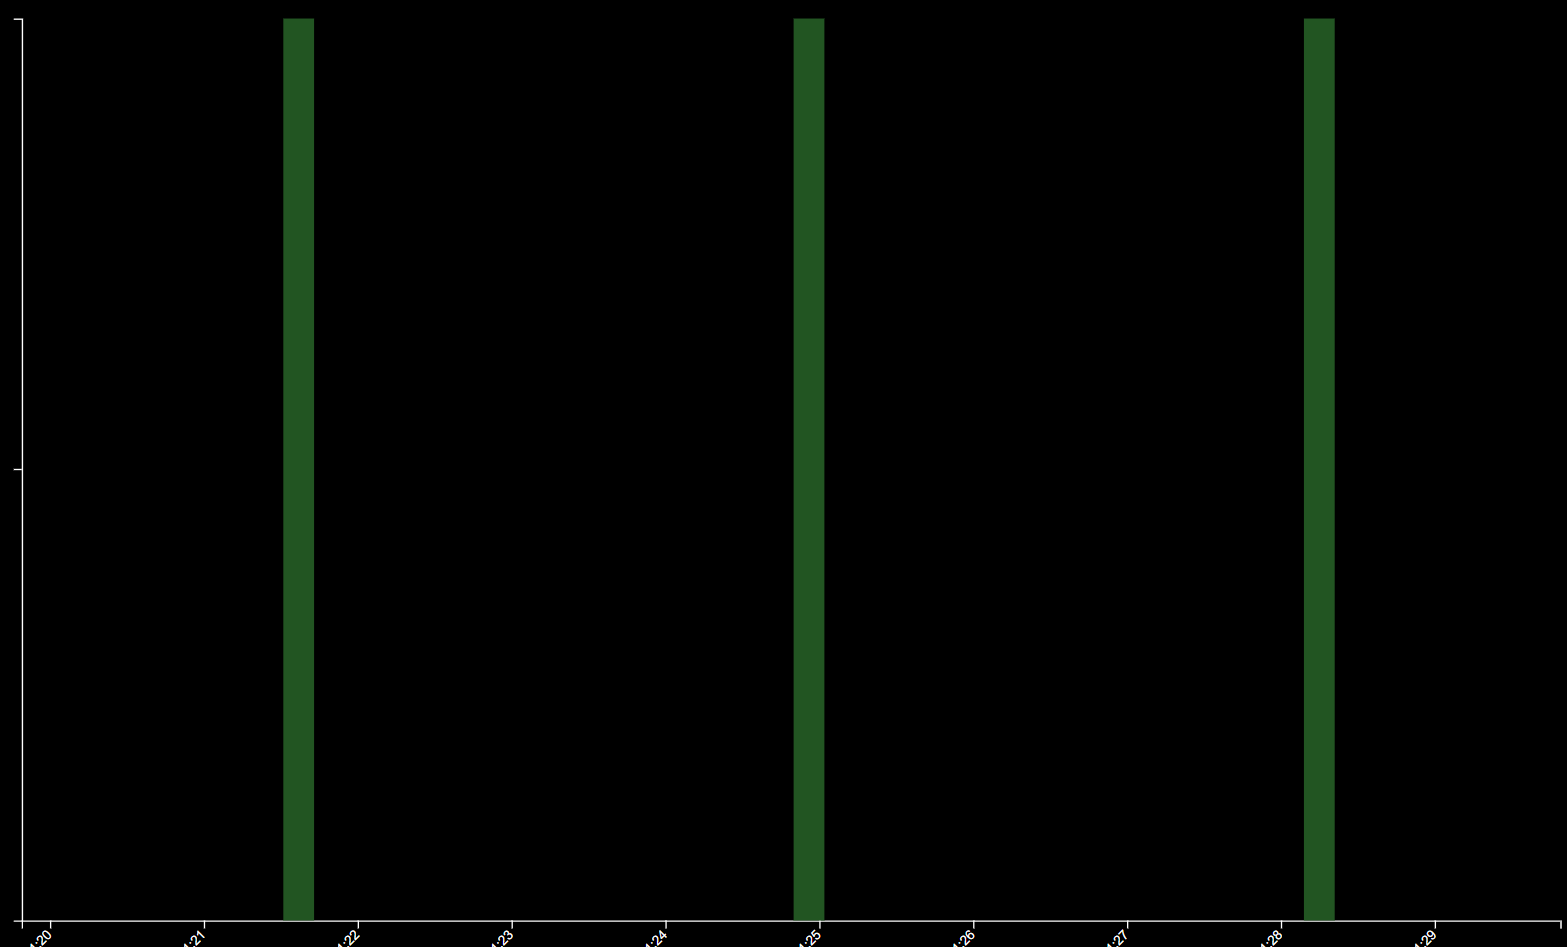
This logic will now highlight whenever the current on the machine exceeds 100%.
Step 2: Capturing Event Data
Often, well want a little more context about our events. The Metadata node allows us to capture specific values from when the event began.
If we wanted to know what the current actually was when the event triggered, we would…
- Right-click the background, choose Add Node, Event and Metadata.
- Drag the output of our Current node into our new Metadata node.
- Right-click the metadata node, choose Title and call it 'Spike'.
This allows us to spot small events where our machine has been using more power than expected.
More Examples
We continue to extend this example in our advanced example.


