Pivot Example: Movement Across Assets
There are a number of different applications where machines move between assets - filling, loading, extracting or simply moving past other pieces of equipment.
It's not unusual to know what values are as you pass the assets or key milestones on their path, or to know the difference in performance across different parts of the line.
In this case, we have a loader that moves on a track between several different product bins, filling them. We'd like to see some details about its activity.
Available Information
| Asset | Property | Desc |
|---|---|---|
| Loader | Odometry | The position of your machine |
| Loader | Speed | The speed the machine is moving |
| Loader | Weight | The tonnage of product the machine is carrying |
Initial Layout
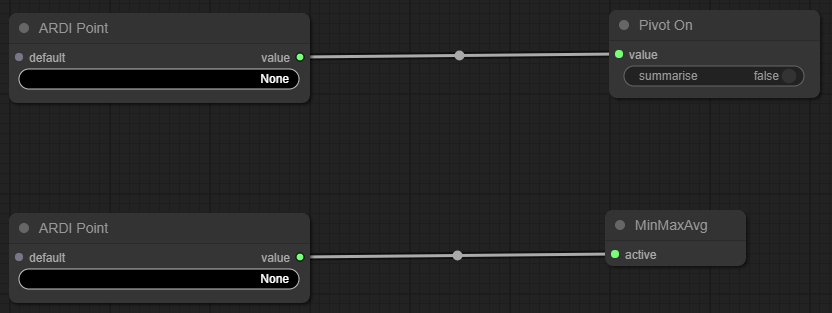
To begin with, we have one Pivot node named Pivot On, and one Pivot Output node named MinMaxAvg
These are both fed by ARDI Point nodes, bringing data in from ARDI asset properties.
Step 1: Choose the Pivot
Our first step is to choose what we are going to pivot on.
In our particular application, our loader is filling up a series of bins. Each bin is 3.5m wide.
Our pivot should be the number of the bin we are filling. We can figure this out mathematically by…
- Getting the position of our loader (in meters),
- Dividing that by the size of each bin (3.5),
- Removing the decimal points
Step 2: Add Measurements
Next, we can choose the measurement we're interested in. Choosing speed would be simple, but we're more interested in knowing how much product we've been feeding into the bins.
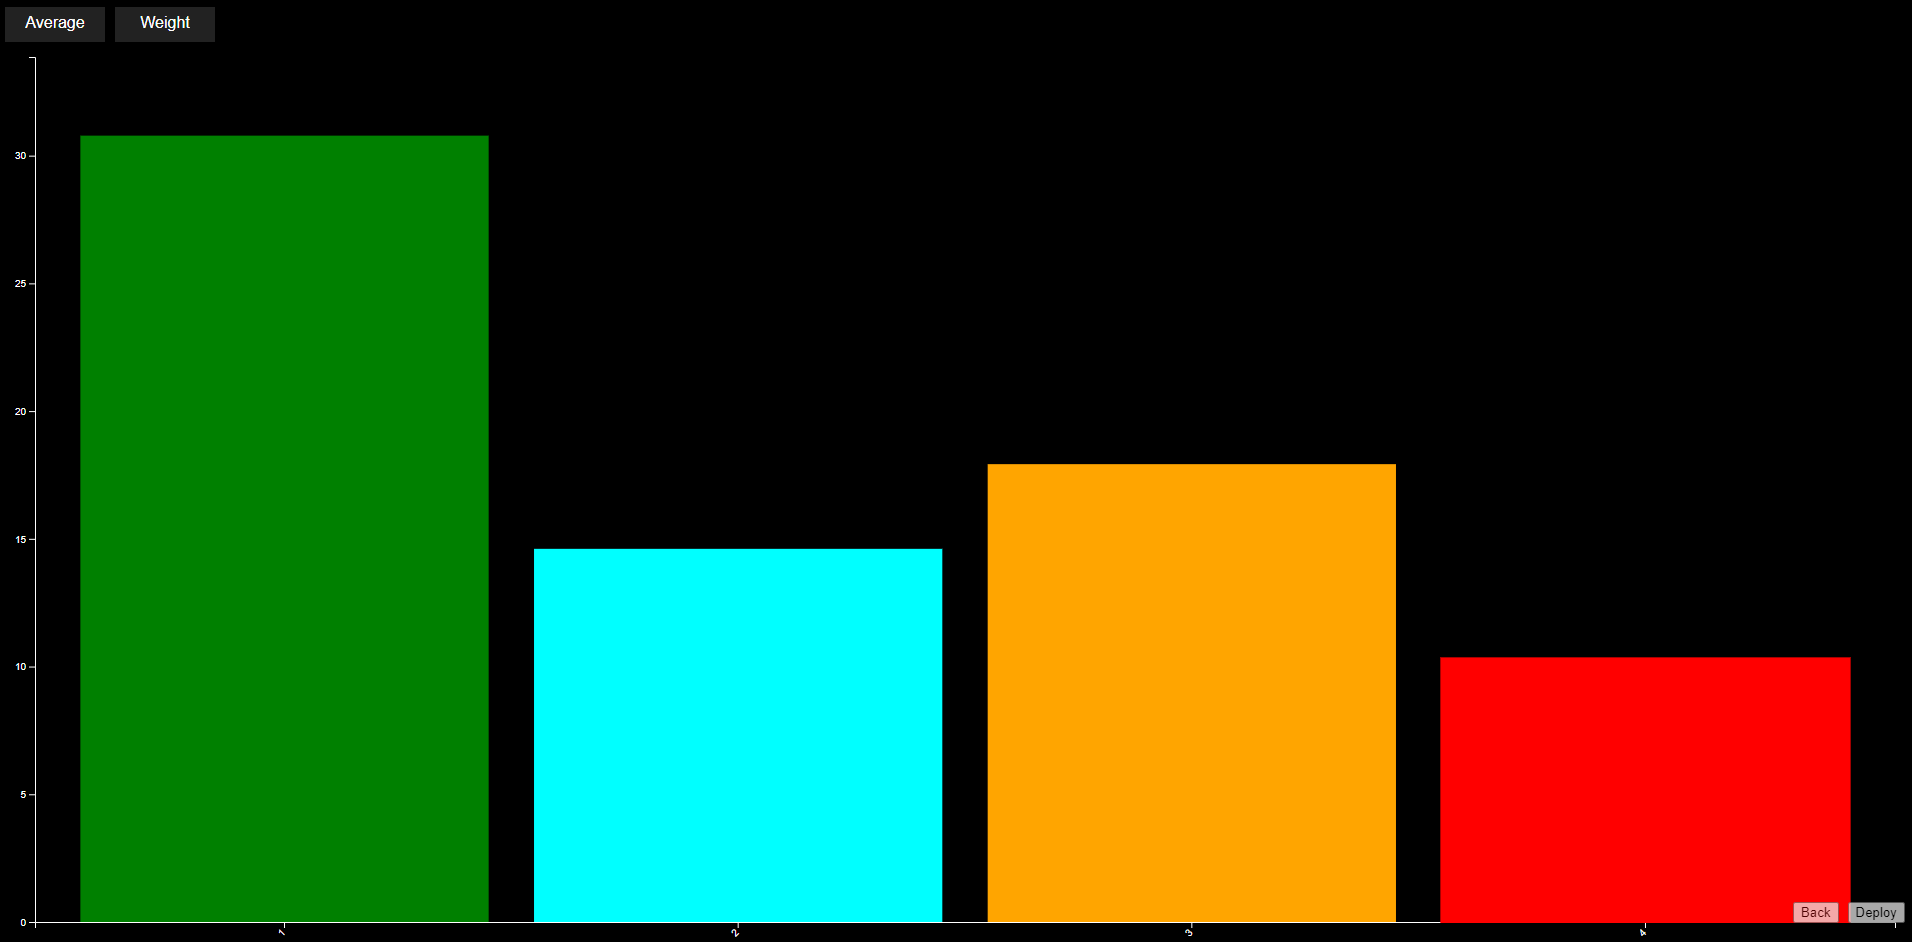
At the moment, we've got a weight sensor in our loader, but none in the bins. Pivot analytics have the Difference node, which is used to record the difference between the value when the asset entered the pivot compared to when it left the pivot.
- Right-click the MinMaxAvg node and choose Delete
- Right-click in the empty space and choose Add Node, Report, Difference.
- Right-click the new node, choose Title and call it 'Weight'
If you feed the weight of the loader into the Difference node, you'll then report on how the weight changed at each hopper.
Step 3: Ignore Filling the Loader
If we were only interested in filling the hoppers, we can use the Ignore node and choose when we should simply ignore data.
These rules can include…
- Ignore any time when the loader is in the loading bay (a position of '0').
- Only use times when the weight in the loader drops rather than rising.


