Pivot Example: By Machine Mode
In this example, we will take the power usage on one of our machines and compare the usage when we are producing product to when we are not producing product.
This will let us know if we are potentially wasting power by running machines when they aren't needed.
Available Information
| Asset | Property | Desc |
|---|---|---|
| Paint Line | Status - Painting | Has a value of 1 when painting, and 0 when stopped. |
| Bridle #5 Roller 1 | Current - Field | The amount of power being used by Roller #1 on the machine |
| Bridle #5 Roller 2 | Current - Field | The amount of power being used by Roller #2 on the machine |
Initial Layout
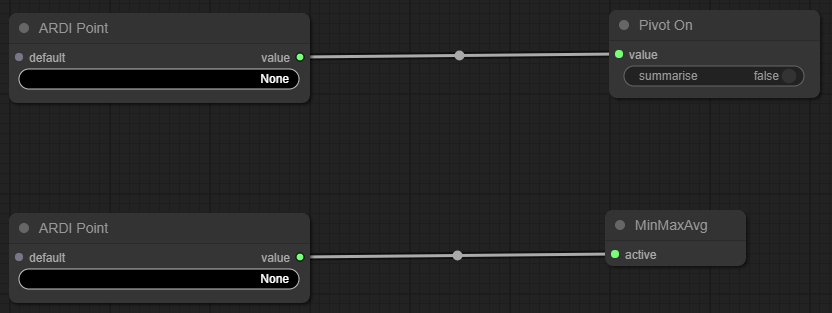
To begin with, we have one Pivot node named Pivot On, and one Pivot Output node named MinMaxAvg
These are both fed by ARDI Point nodes, bringing data in from ARDI asset properties.
Step 1: Choose the Pivot
Our first step is to choose what we are going to pivot on.
- Click on the ARDI Point node that feeds the Pivot On node.
- Choose Status - Painting from the list
- Right click the Pivot On node and choose 'Title' from the list
- Enter the name 'Painting' as the name of the pivot.
Step 2: Add the Two Roller Values
Next, we need to choose the data we want to see for each pivot value.
In this case, there are two parts to this machine that each have their own power usage monitoring. Although pivot analytics can have more than one output, in this case we only care about the total power being used, so we need to add the power usage together.
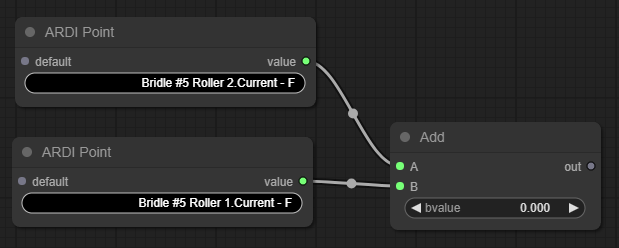
Get the Roller 1 Power
- Click on the ARDI Point already connected to the MinMaxAvg node.
- Choose Bridle #5 Roller 1 Current - Field as the property.
Get the Roller 2 Power
- Right-click on the point you just edited, and choose Clone.
- Click on the property and choose Bridle #5 Roller 2 Current - Field as the property
Add them Together
- Right-click on empty space, choose Add Node, Math and Add.
- Drag both Bridle #5 nodes into the new Add node you created to add both values together.
Connect to the Output
- Drag the output of the Add node into the MinMaxAvg node.
- Right-click the MinMaxAvg node and choose Title.
- Enter the name 'Power Usage'
Analytic Complete
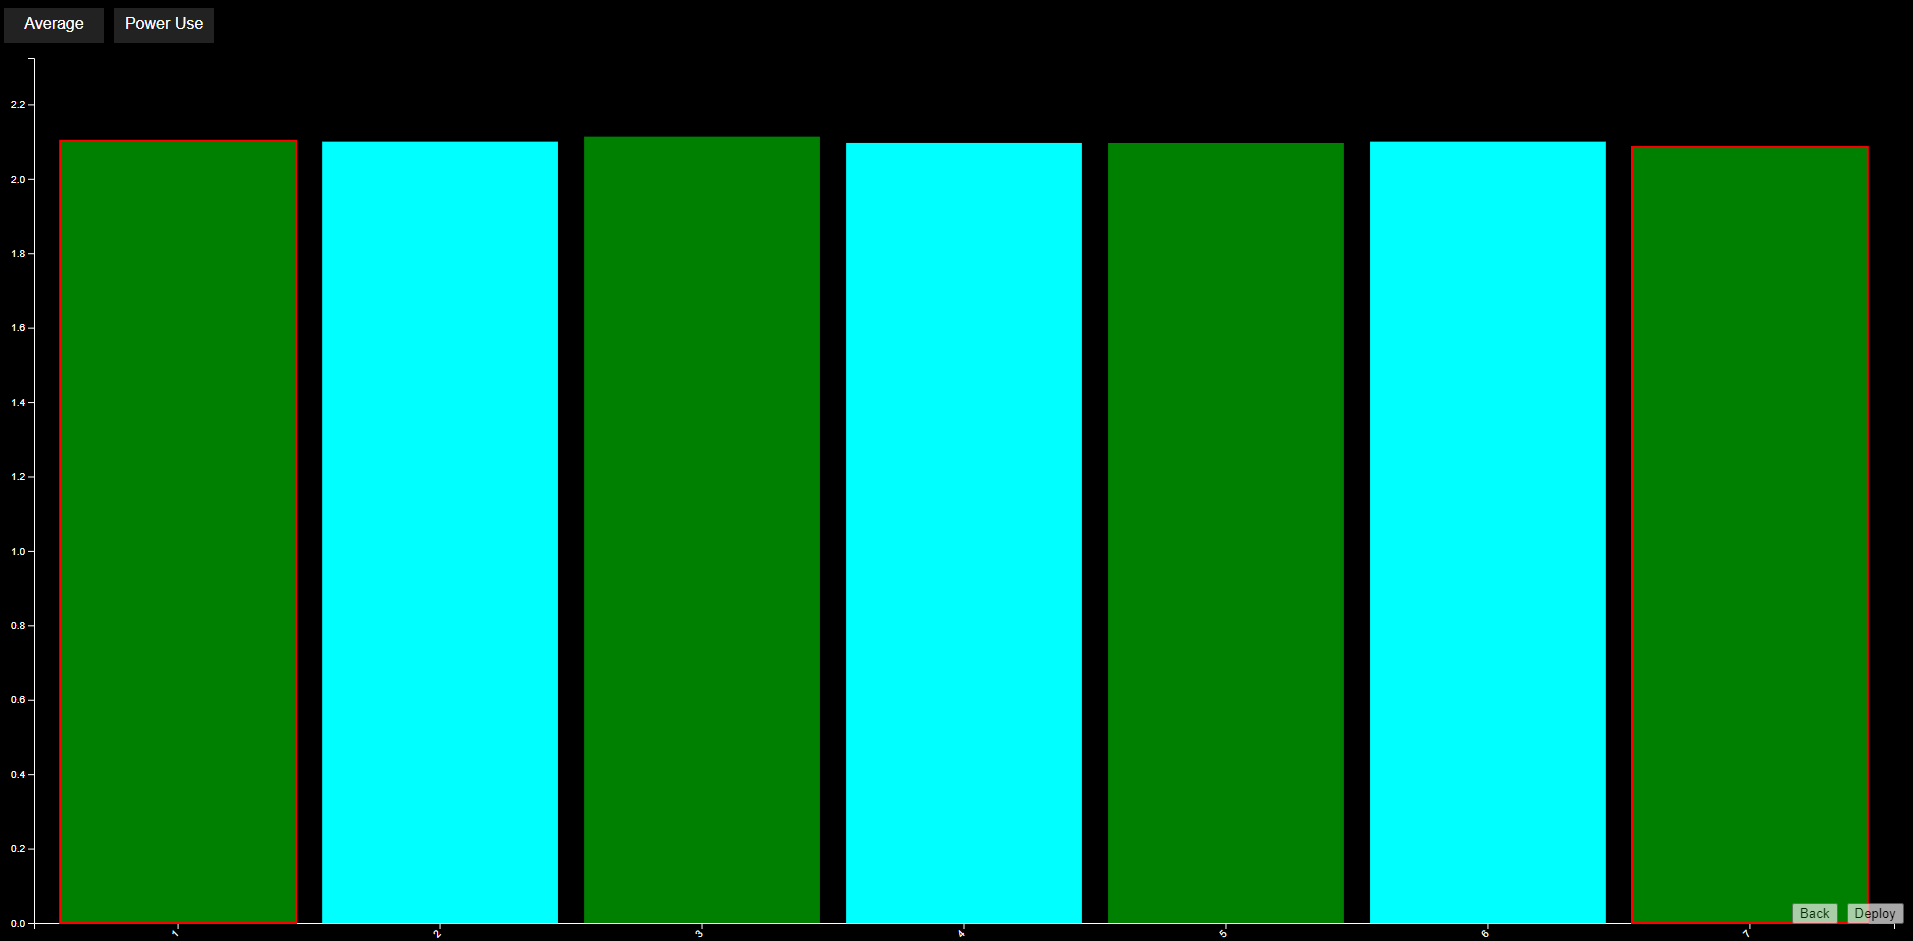
And you're done - by pressing Save and Visualise, you'll have a simple analytic showing power usage when you're painting vs usage when you're not painting.
Further Refinement
One issue at the moment is that the pivot value is a number.
Although in this case people may be able to guess that '1' means running and '0' means stopped, it's not obvious. And it's particularly awkward when your pivot values has a number of different possible values.
You can convert the number into human-readable text using the ARDI Value to Text node.
This node reads the lookup table out of your ARDI properties and applies it to one of your values. For example…
There are some significant advantages of using this node instead of using logic to choose the name…
- The visual analytic is much simpler to create and understand,
- The analytic will automatically adapt if any changes are made to the property values,
- The analytic will function across sites if the modes or their numbers differ from site-to-site.


