Python Module
The Python module is used to call a Python script to process the results of your logic.
The analytic performs the following steps…
- The analytic is run over the requested time range, writing data to one or more Python Output nodes.
- The python script is called, with a JSON-encoded list of values that contain the time of each sample and a value for each of the Python Output nodes in the graph.
- The Python script writes out JSON-encoded text, which is then processed by the ARDI server before being delivered to the user.
Starting Out
When creating a Python analytic, you'll be asked for the path to the Python file you want to use. It's important that you enter the path that the server should open.
This file will then be scanned for the special comments that let the system know what inputs the script expects.
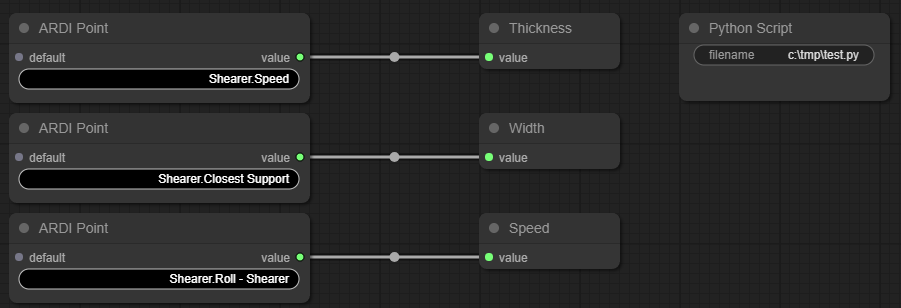
Once the analytic is open, you'll see something similar to the graph below…
Each of the left-hand nodes are simply ARDI Point nodes, flowing data into the right-hand nodes, which are Python Outputs.
This feeds those values into the Python script.
See Writing the Python Script for some details on how the process works.
Why Python
Python analytics are used when you want to leverage the flexibility and power of Python in an analytic.
We don't suggest using this module for simple calculations or transformations - these can be achieved more efficiently using the other available analytic modules. Since it takes time to launch and transfer data between ARDI and Python, Python analytics are often slower than the something similar using ARDI alone.
But fortunately, Python is a language with a very low barrier to entry, a huge amount of online resources, and great tools for Machine Learning, data analysis and manipulation. So if you're trying to do something unique with your analytics, it's certainly a powerful option.
