Full Cycle Integration
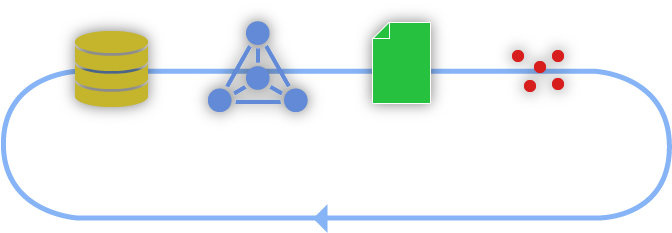
ARDI encourages what we call full cycle integration.
This means that if your ARDI-powered analytics calculate any new values - such as detecting events, producing totals or KPIs - we encourage developers to push these values back to ARDI.
There are several advantages to this…
* Your new insights are available to staff across the organisation,
* Your new values can be visualised and distributed using ARDI tools,
* You're able to perform meta-analysis and summaries using the same engine as your raw data analysis.
This 'pushing back' can be through a variety of methods.
* Record the data back into your industrial historian (ideal for high-speed/live/model data)
* Record the data into a database (for event/low-speed data), or
* Push the data back into ARDIs Modular Output System driver so it can be recorded into Prometheus (where you don't have suitable database infrastructure).
Example
Raw Data
In one of our systems, there's a 'Charge Car'. It's a mobile piece of equipment that runs on rails to take raw product from a hopper to one of the ovens that 'cook' the product.
The charge car has a weight sensor to detect how much product is inside it, but none of the ovens do.
Oven Data
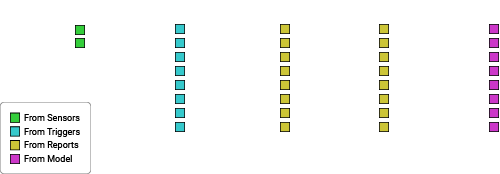
We can use trigger to detect when the charge car loads and unloads. Based on where it's unloading, we can create new data points for each oven that describe how many tonnes of product were placed in each oven.
Timing Predictions
By pushing that data back to ARDI, you can create a live model that predicts how long each oven is going to take to complete the batch it's cooking.
Short Term Reporting
You can also generate a report that describes how much product was produced by each oven at your choice of resolution - for example, per hour or per day.
By pushing this data back to ARDI, the figures are available to operators and engineers. Through 3D visualisations or dashboards, they can easily look at which ovens have been less efficient or aren't being fed product correctly.
And you don't need to create these dashboards - once the data is in ARDI, it's available through Data Explorer and other ARDI Clients. But of course you can create your own unique reports, dashboards and displays too.
Long Term Analytics
You've then also got an accurate, recorded daily value you can use when you want to produce long-term reports. This means you can produce weekly, monthly or year-to-date reports quickly and without having to build the data from scratch each time, since making a yearly report based on sub-second data takes a significant amount of time and resources.
By using ARDI tools and feeding data back into ARDI for analysis, you can take just two channels of data (Car Weight and Car Location) and turns them into dozens or even hundreds of useful points of insight.
And these points will be dynamic - if you add new ovens or a new charge car, new analytics will be automatically created around them. If you move your solution between sites, it can quickly adapt to the new system.

