Trending
Available from the capture list, this page lets you look at the trends of the chosen captures over time.
For example, if you were keeping track of your total amount of production from day-to-day, you could use the trends page to view a chart of your performance over days, weeks or months.
Min/Max Values
At the top of the page is a list of minimum and maximum values for each captured point of data. Note that this will only display values that actually change across the different captures - if the value is identical for every capture, it simply won't appear in the list.
Line Chart
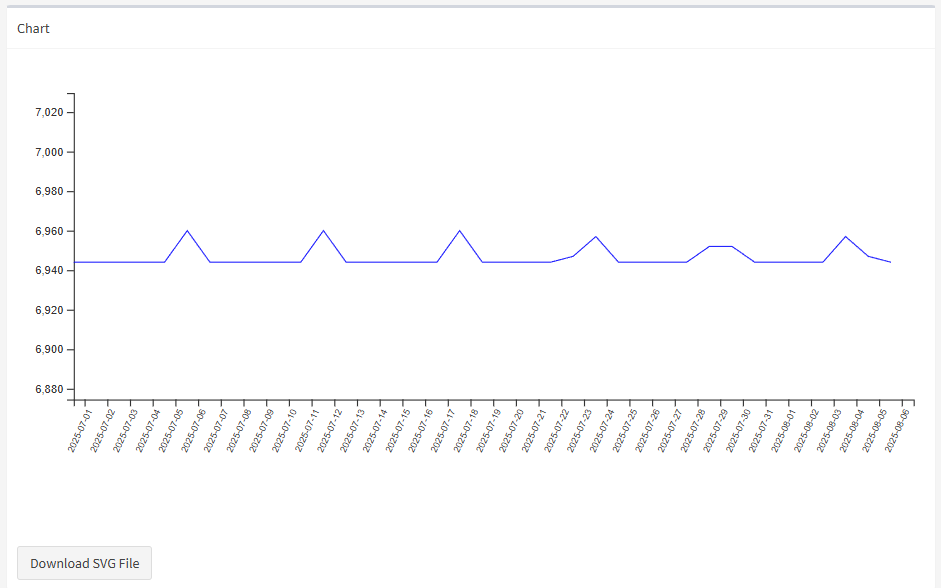
Below the min/max values is a line chart showing how the value changes over time.
You can add and remove lines from this chart by clicking on the names of the different data points in the min/max list.
Clicking on a given point on the chart will take you to the details for that particular capture.

