Bar Charts
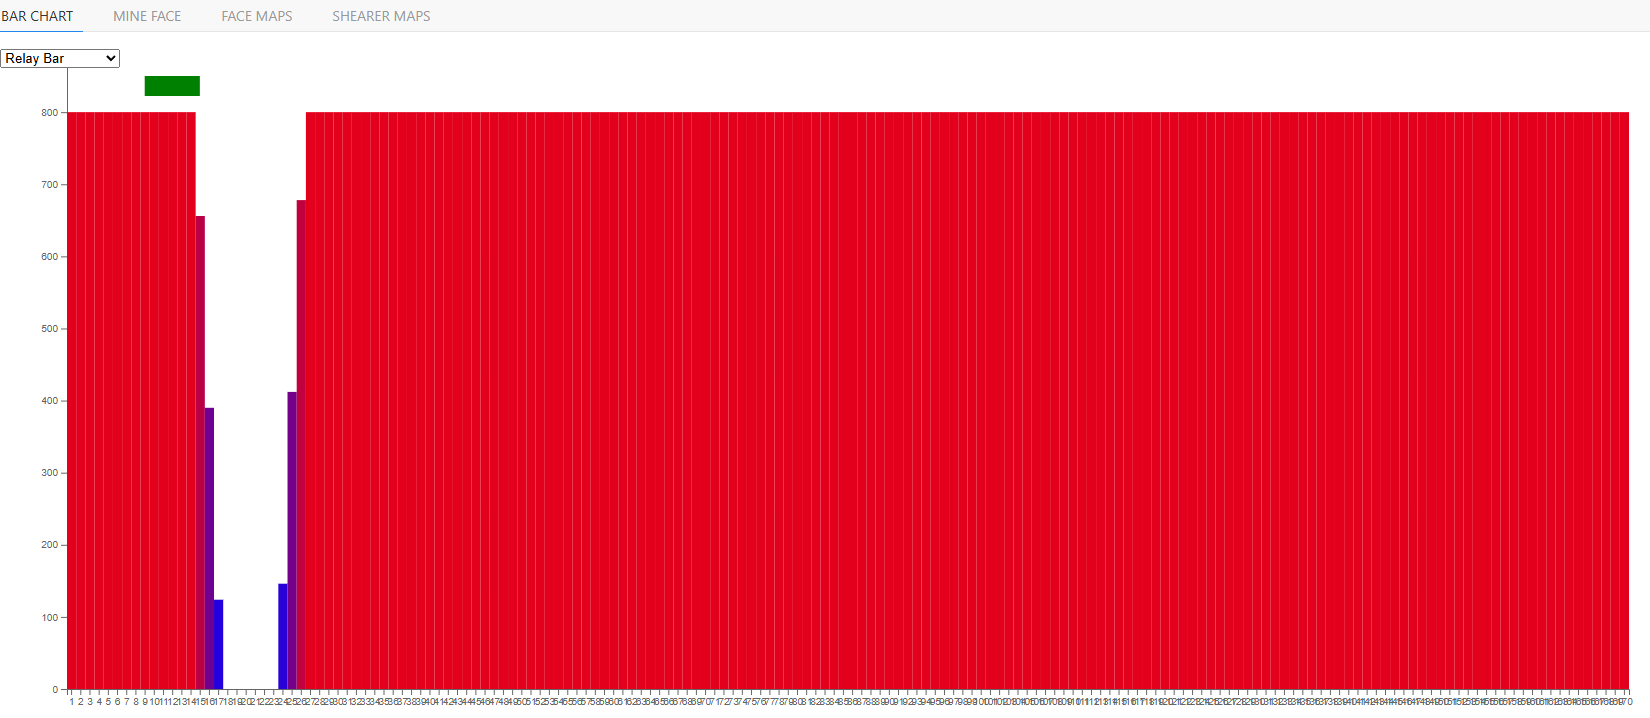
This display in the Face Display application shows a bar chart highlighting a particular value across each of the Roof Supports on our demo system.
You can choose which property you'd like to view using the drop-box at the top-left corner.
This chart is live - it will animate as new data arrives.
The green box at the top of the chart shows the position of the shearer. You'll notice that several variables change as it passes.
Items of Interest
The Relay Bar value will drop radically behind the shearer as it moves across the face.
Looking at Pressure will highlight a faulty support and a cavity (an area where the roof is unstable and unsupported).
