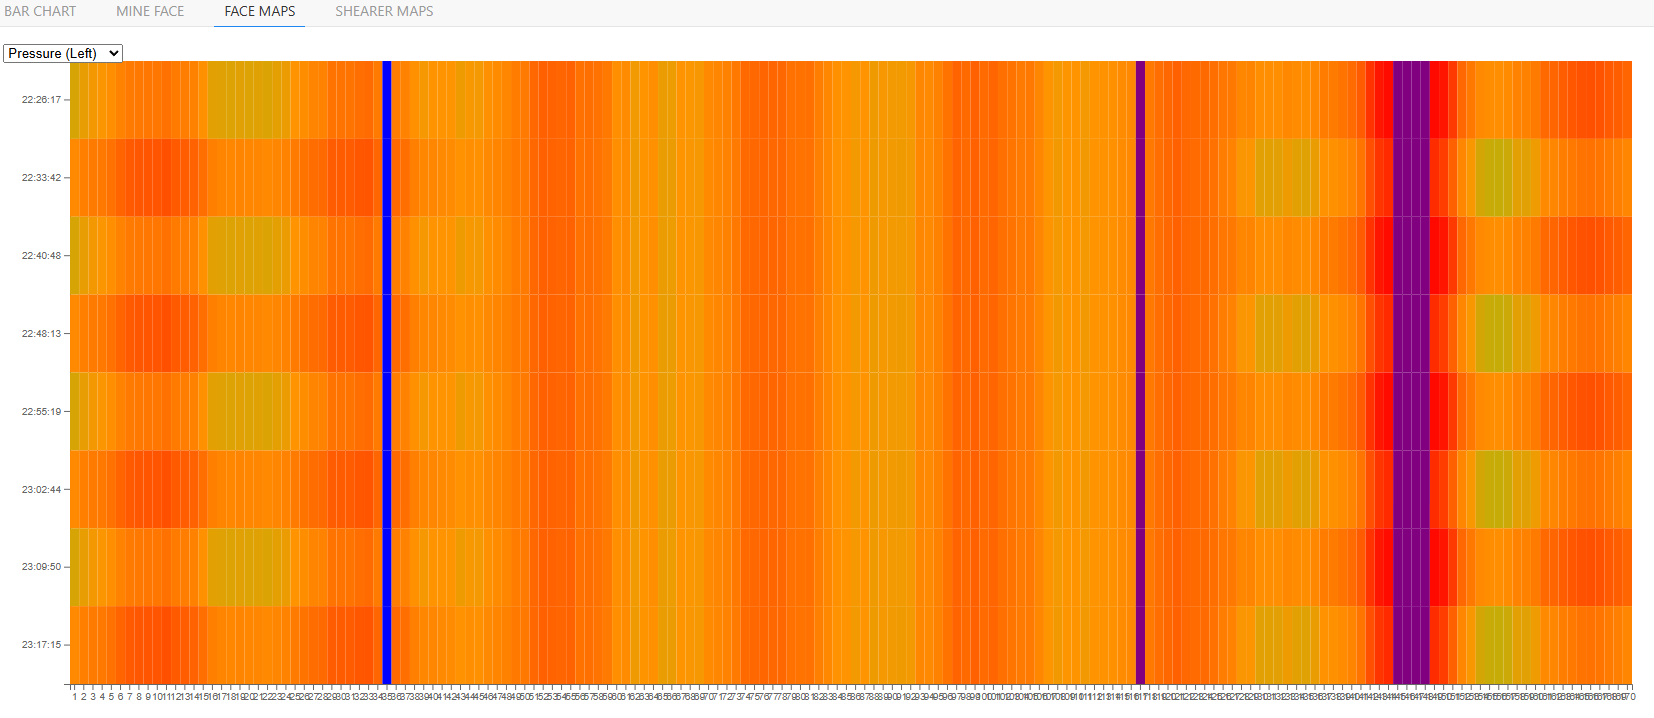
Face Maps
It's important to look for long-term trends in the behaviour or a longwall mine, so you can look for signs of emerging issues.
Most mines break their activity into shears. A shear is similar to a batch, and represents a single pass of the shearer from one side of the face to the other.
The third display in the Face Display application creates Face Maps ( or shear heatmaps ). These are heatmaps that show you the average value of any given roof support property from shear to shear, letting you see progressive changes in the condition of the longwall over time.
Animation
The animation isn't just for show - it takes a few moments to load each shear of data from history, so individual shears are drawn in as soon as data is available. The direction that the data appears from (ie. from left-to-right or right-to-left) indicates the direction the shearer was moving during the cut.
