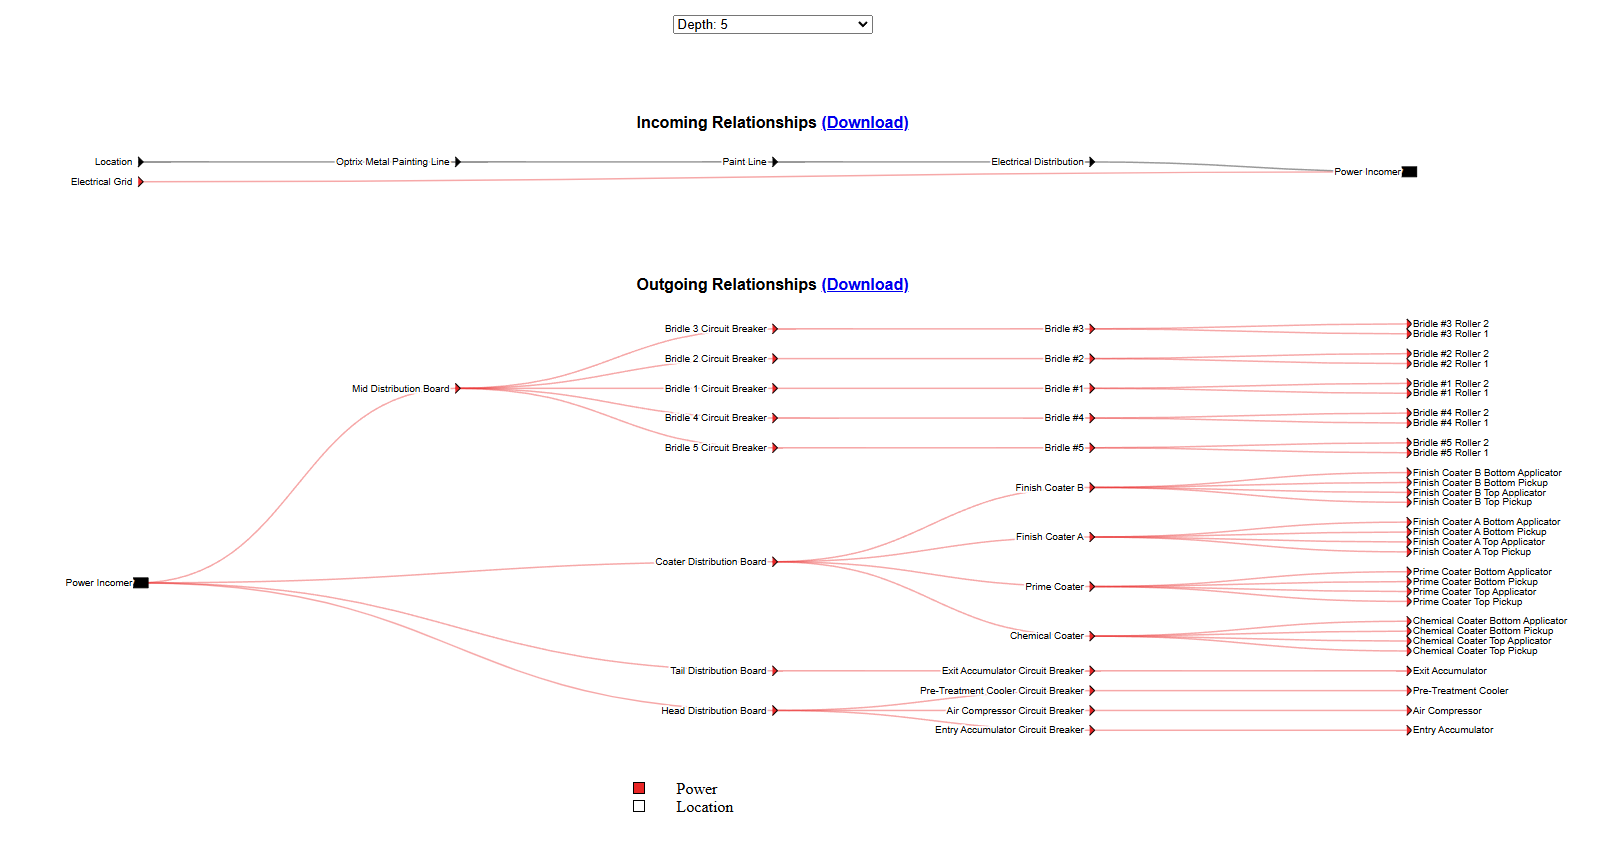
Network Diagram Addon

The network addon gives you a new visualisation for the ARDI web interface.

It produces force-directed network diagrams of your relationships - an view of your an entire relationship, showing every asset at once.

Accessing the Diagrams

You can access the diagram by clicking on the 'Network' button in your sidebar, or through the 'Network' button that appears on any diagram page of a physical relationship.

Note that the bulk of the work for creating the diagram is done on your PC rather than by the server. This means that large, complex relationship drawings will take significantly longer to produce than diagrams covering smaller systems.

Understanding the Diagrams

The yellow rounded-boxes in each diagram are the source points - where ARDI beleives your relationship starts.

For all other assets, the following colours and shapes may appear…

ShapeMeaning
CircleA normal asset
DiamondAn asset where a flow is diverted, rather than distributed evenly
Downwards ArrowAn asset where your media is transformed into something else
ColourMeaning
DefaultNormally, the assets take the colour of the relationship you are viewing.
RedThere is an active alert on the asset.
PinkThere is an active alert on an asset that is a critical part of the asset
YellowThe source of the relationship
GreenThe asset you used to open the diagram.

Interacting

You can interact with your diagram using the mouse.

Spin the mouse-wheel to zoom in and out.
You can hold the left mouse button down and drag on empty space to pan - this moves around the diagram.
Single-click on an asset to get its full name and other major, physical relationships.
Double-click on an asset to open the dashboard.
Left-click-and-drag on an asset to adjust its position in the drawing - it all of it's connected items will also follow. Note that the asset may be pulled back into position over time.