Outage Report Example: Simple
In this example, we'll look at the outages we've experienced on our Paint Line, and try to classify why some outages happened.
Complexity
Because this is more complex than some other metrics, this tutorial isn't quite as step-by-step as the previous examples. It's assumed that you know how to add a node and are familiar with some of the basic node types.
If you're new to the visual analytic system, we suggest looking at the tutorials for simpler modules, such as Control or Pivots.
Available Information
| Asset | Property | Desc |
|---|---|---|
| Paint Line | Status - Painting | Has a value of 1 when painting, and 0 when stopped. |
| Paint Line | Actual Speed | The speed the machine is running |
| Paint Line | Thickness | The thickness of the product being produced |
| Paint Line | Width | The width of the product being produced |
Initial Layout
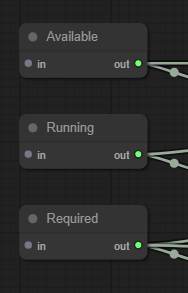
The key nodes are the three on the far-left. We need to provide logic for how the system can tell that the asset is…
- Available (should be able to run if requested),
- Running (actually running), and
- Required (needed to run)
Step 1: Available, Running & Required
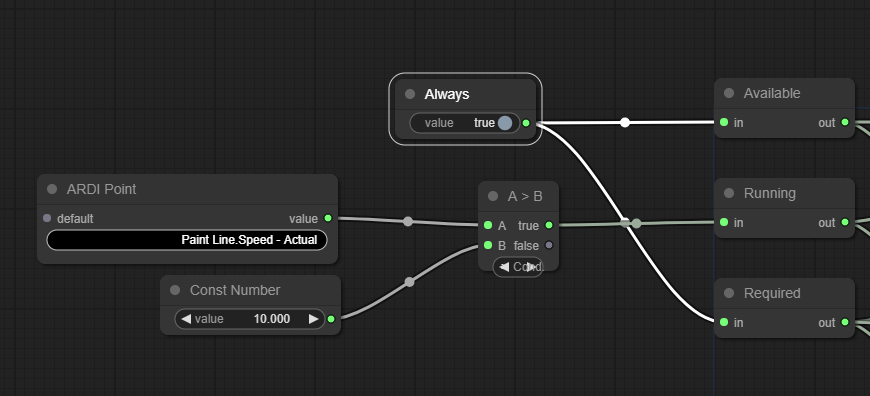
The first step is to choose the rule we will use to tell if the machine is available.
While the OEE example has more complex logic, this time we're looking at the system as a whole.
It's always expected to be available and running.
It's actually is running when the speed is more than 10 meters per minute.
The logic for those rules looks like this…
Step 2: Processing Events
The Outage Reporting analytics have a special input node, called Event Compare.
This node is run after all of the categorisation has taken place. Then for each different outage time-period that was detected, the Event Compare node is run.
This lets you compare the values at the start and at the end of your event to see if you can get any other insight into what type of outage it was.
In our example, we can compare the value of Product Thickness at the start of our event with the thickness at the end of the event - and if it's changed, we can mark the event as a Thickness Change.
The Event Compare node has three outputs - the start offset, the end offset, and the duration of the event. The offset amount is in samples relative to the start of the query time, and can be used with the ARDI PastPoint node to read a property value from a point in the past.


