Pivot Example: By Product Characteristic
Choosing Pivot Data
Because pivoting makes new entries for every unique pivot value, we suggest that you only pivot on properties that step rapidly between values, or you take advantage of functions such as Round to remove decimal places.
The best pivots are non-sensor data, such as batch number, product code or other inputs from your production scheduling systems.
This Example
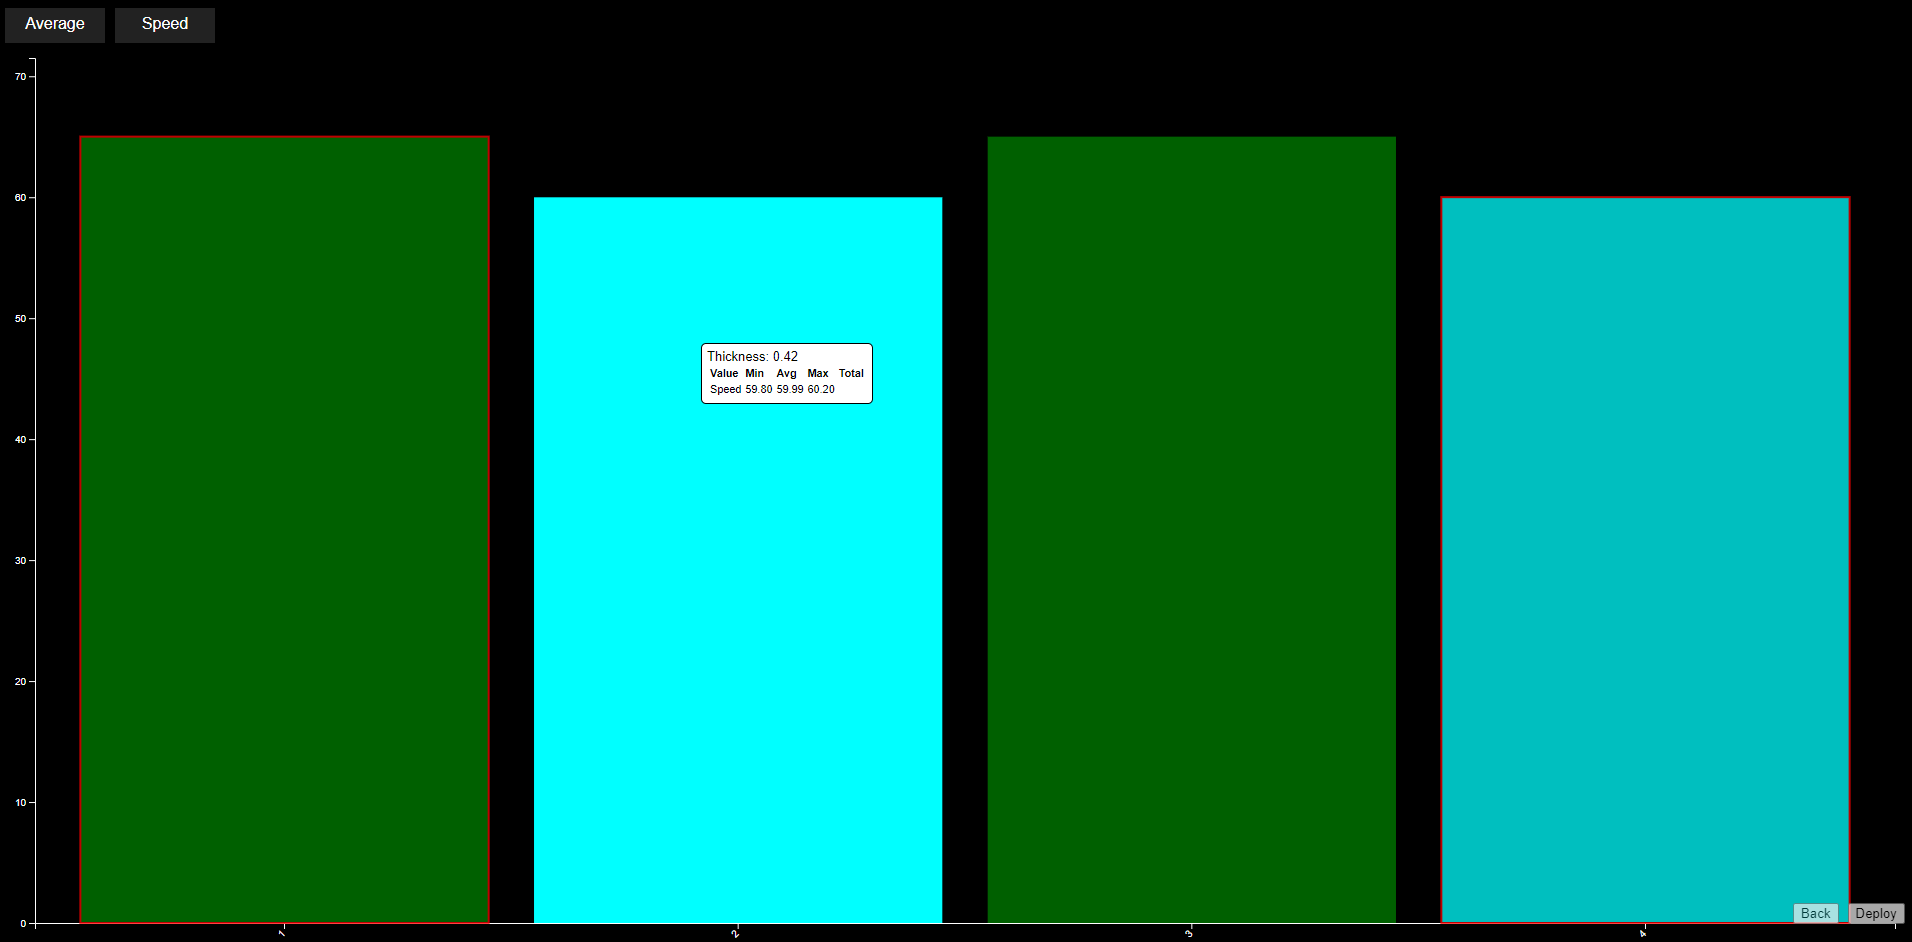
In this example, we're going to use a pivot analytic to see how quickly our production line is creating different thicknesses of product.
This will let us know if thickness is relevant, and which particular thicknesses are causing problems.
Available Information
| Asset | Property | Desc |
|---|---|---|
| Paint Line | Status - Painting | Has a value of 1 when painting, and 0 when stopped. |
| Paint Line | Speed - Actual | The speed of our product line |
| Paint Line | Thickness | The thickness of the product being processed |
Initial Layout
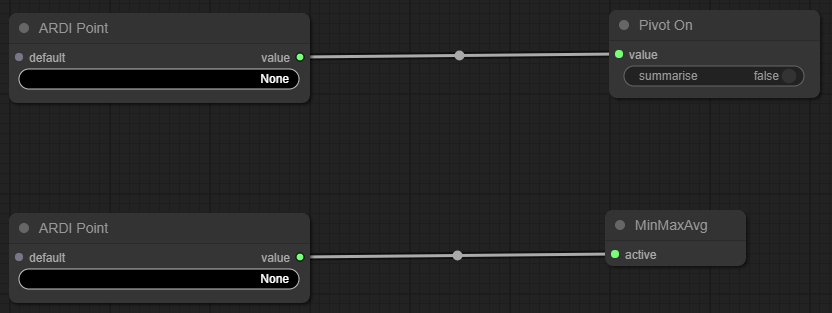
To begin with, we have one Pivot node named Pivot On, and one Pivot Output node named MinMaxAvg
These are both fed by ARDI Point nodes, bringing data in from ARDI asset properties.
Step 1: Choose the Pivot
Our first step is to choose what we are going to pivot on.
- Click on the ARDI Point node that feeds the Pivot On node.
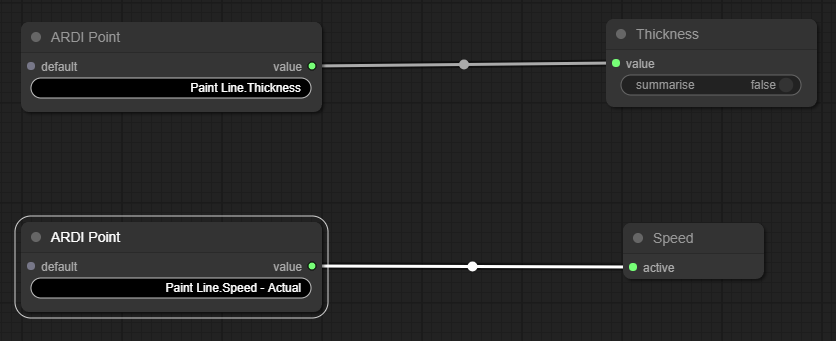
- Choose Paint Line Thickness from the list
- Right click the Pivot On node and choose 'Title' from the list
- Enter the name 'Thickness' as the name of the pivot.
Step 2: Add the Speed Measurement
- Click on the ARDI Point already connected to the MinMaxAvg node.
- Choose Paint Line Speed - Actual as the property.
- Right-click the MinMaxAvg node and choose Title.
- Enter the name 'Speed'
Step 3: Ignoring Transitions
If we pressed Save and Visualise right now, we'd have a working analytic. But there would be some issues.
Although the thickness value from our system changes abruptly between the old and new value, the process itself takes time to adjust itself to the new product. This is called a transition.
This gradual movement from the old product to the new causes our 'max' and 'min' values for each product to bleed into one-another slightly. Although the average values are good, but the maximum and minimum values also include the speeds from the product before and the product after.
Luckily, we can see the transition is happening when the lines status goes from 'painting' (1) to 'stopped' (0).
Pivot analytics also include an Ignore Node. If the input to this node is ever true or 1, any values will simply be ignored and not assigned to any pivot value.
Adding The Ignore Node
- Right-click in the empty space on the graph, and choose Add Node, Report and Ignore.
Add the Status
Next, you'll need to add the status.
Although you can use a normal ARDI Point node and a comparison, we've included an easy way to deal with digital values with the ARDI Status node, which has dedicated outputs for true and false.
- Right-click in the empty space on the graph and choose Add Node, ARDI and ARDI Status.
- Left-click where it says None on the new node, and choose the Paint Line Status - Painting property from the list.
- Connect the second output (named false) on the new node to the input of the Ignore node.
Analytic Complete
We now have a complete analytic that shows us the different speeds based on product thickness, ignoring those disruptive product transitions.
See More
If there wasn't any pre-made method of detecting a transition, you might want to instead use a timer to ignore a window of time.


