Correlation Detail
This page shows the specifics of a correlation between two properties, and is reached via the asset correlation page.
Correlation Score
First is the panel giving a score (as a percentage) of how tightly-connected your two values are. As a general rule, the higher this number, the stronger the relationship.
Other Asset Correlations
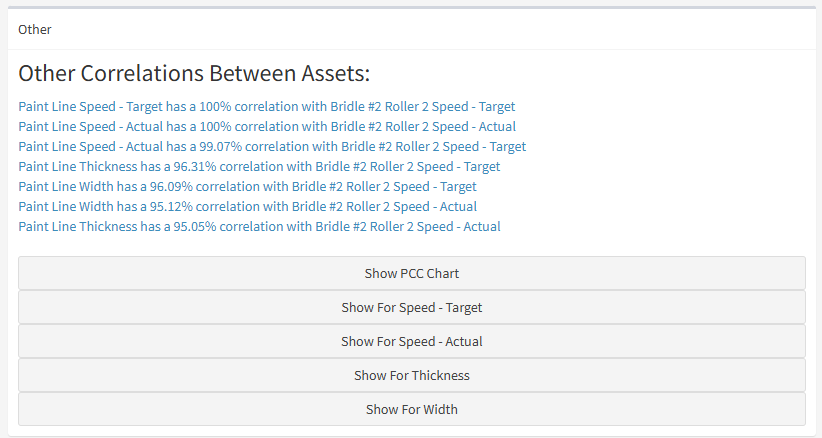
Next, you'll see a panel detailing any other correlations the two assets have in common.
As a general rule, the more links assets have, the more likely that the correlation is genuine. If many different properties are correlated, it might indicate that the link is complex.
In the example above, the Speed, Width and Thickness are all correlated. This indicates that there's a complex interplay between all three variables.
You can use the provided buttons to show PCCs (Parallel Coordinate Charts) for these values. See Reading PCCs for more detail.
Structural
This shows any structural elements that the two assets share in common, using ARDIs relationships.
The more physical or logical connections the assets have, the more likely they are to genuinely interact.
Summary
This section summarises the content from the previous panels. It tries to make a best-guess about if the two properties are genuine connection, or simply coincidence.
Other Links
The final section lists similar correlations you might be interested in investigating.


