Dashboard
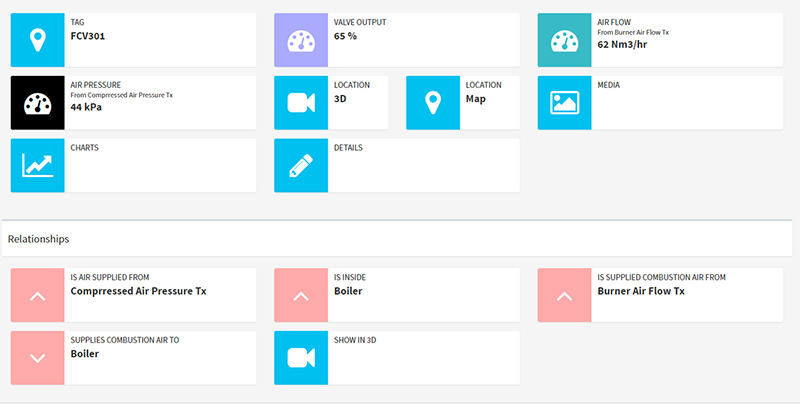
The dashboard gives you an overview and a gateway to everything ARDI knows about your asset.
As well as the name and description of your asset (not shown in the image above), each box gives you a different piece of information about your asset.
Properties
Some boxes represent properties, such as the Valve Output above.
Some properties, such as Air Pressure and Air Flow appear because of property flow - in this case, the asset is connected to an air line, so these figures are coming in from an upstream device.
Clicking on any of these properties allows you to see trend charts.
The value of any properties linked to live data will automatically update while you watch.
Status
The dashboard will indicate asset statuses, including…
- Any active alerts
- Any alerts active on upstream, connected assets
- If the asset is isolated ( this option only available on some ARDI servers )
- If the asset is at zero energy ( this option only available on some ARDI servers )
Location
The asset also has a location, which allows us to show it in 3D or on 2D maps.
Additional Information
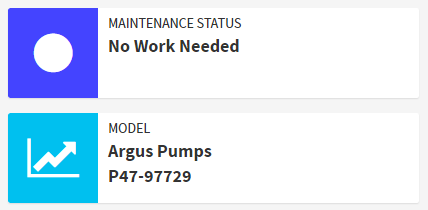
Your ARDI server may be connected to other knowledge-management systems, which results in extra items on your dashboard.
For example, if you're connected to a maintenance system, you might see extra details about your asset and its maintenance status.
Media
The media button allows you to access any documentation your asset may have - manuals, calibration sheets, work instructions etc.
Charts
While clicking directly on a property will pop up a trend, if you'd like to create more elaborate charts, the button here will take you to where you can make one.
Relationships
At the bottom of the dashboard page are descriptions of the relationships your asset has. You can move through your relationships by clicking on them.
Unknown & Grey Measurements
In some cases, the values shown in your measurements may appear as unknown or will be silver, instead of the usual black.
This is caused by something upstream causing uncertainty about the measurement.
Grey values represent indicate that the value is approximate. These usually occur if you have non-return valves, diode modules etc. in your system. ARDI can estimate the value, but it's possible that it is in fact something different.
Unknown values occur when there is an isolation somewhere between this asset and the measurement point. Because there is no sensor available, ARDI can't guarantee that the value is zero. Since the isolation may have failed or there may be energy trapped in the system, this encourages people to double-check for energy manually.
See Also: Diagrams

